Evaluate Deviations with Saner CSPA
Posture anomaly (PA) is a critical aspect of assessing deviations in resources across the cloud. These anomalies are typically identified using statistical algorithms and security best practices. Saner CSPA, however, uncovers unusual or anomalous data points based on predefined rules and thresholds.
How Does Saner CSPA Analyse Posture Anomaly?
Saner CSPA establishes specific conditions or thresholds derived from domain expertise. It analyzes the dataset and compares each data point against these defined rules, flagging any data point that violates a rule. The scanner is configured to run continuously, day after day, to identify unwanted elements or anomalies within the organization and to either fix or whitelist these anomalies using pre-built response schemes.
The centralized dashboard supports visualization and lists all anomalies, categorizing them based on confidence levels. This provides an instant solution to either fix or whitelist exceptions that are deemed acceptable within the organization. Additionally, the dashboard offers intuitive insights into which anomalies should be whitelisted and what actions should be taken to mitigate non-compliance.
Below are the actions you can perform on the detected anomalous data in the Cloud Security Posture Anomaly(CSPA) Dashboard:
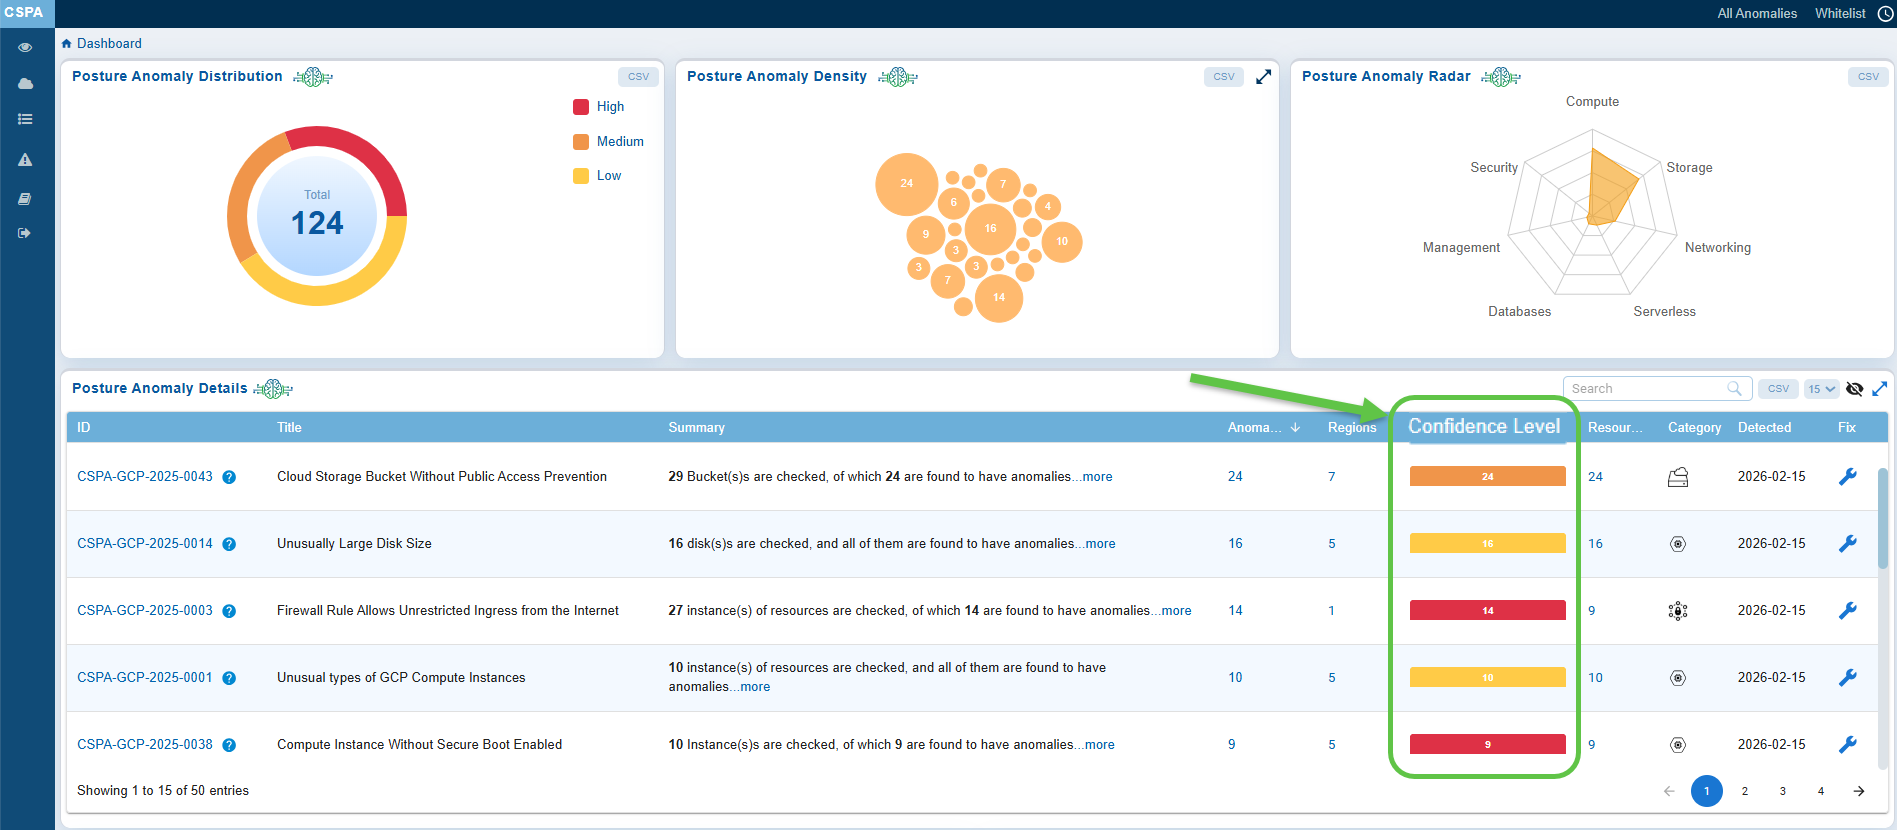
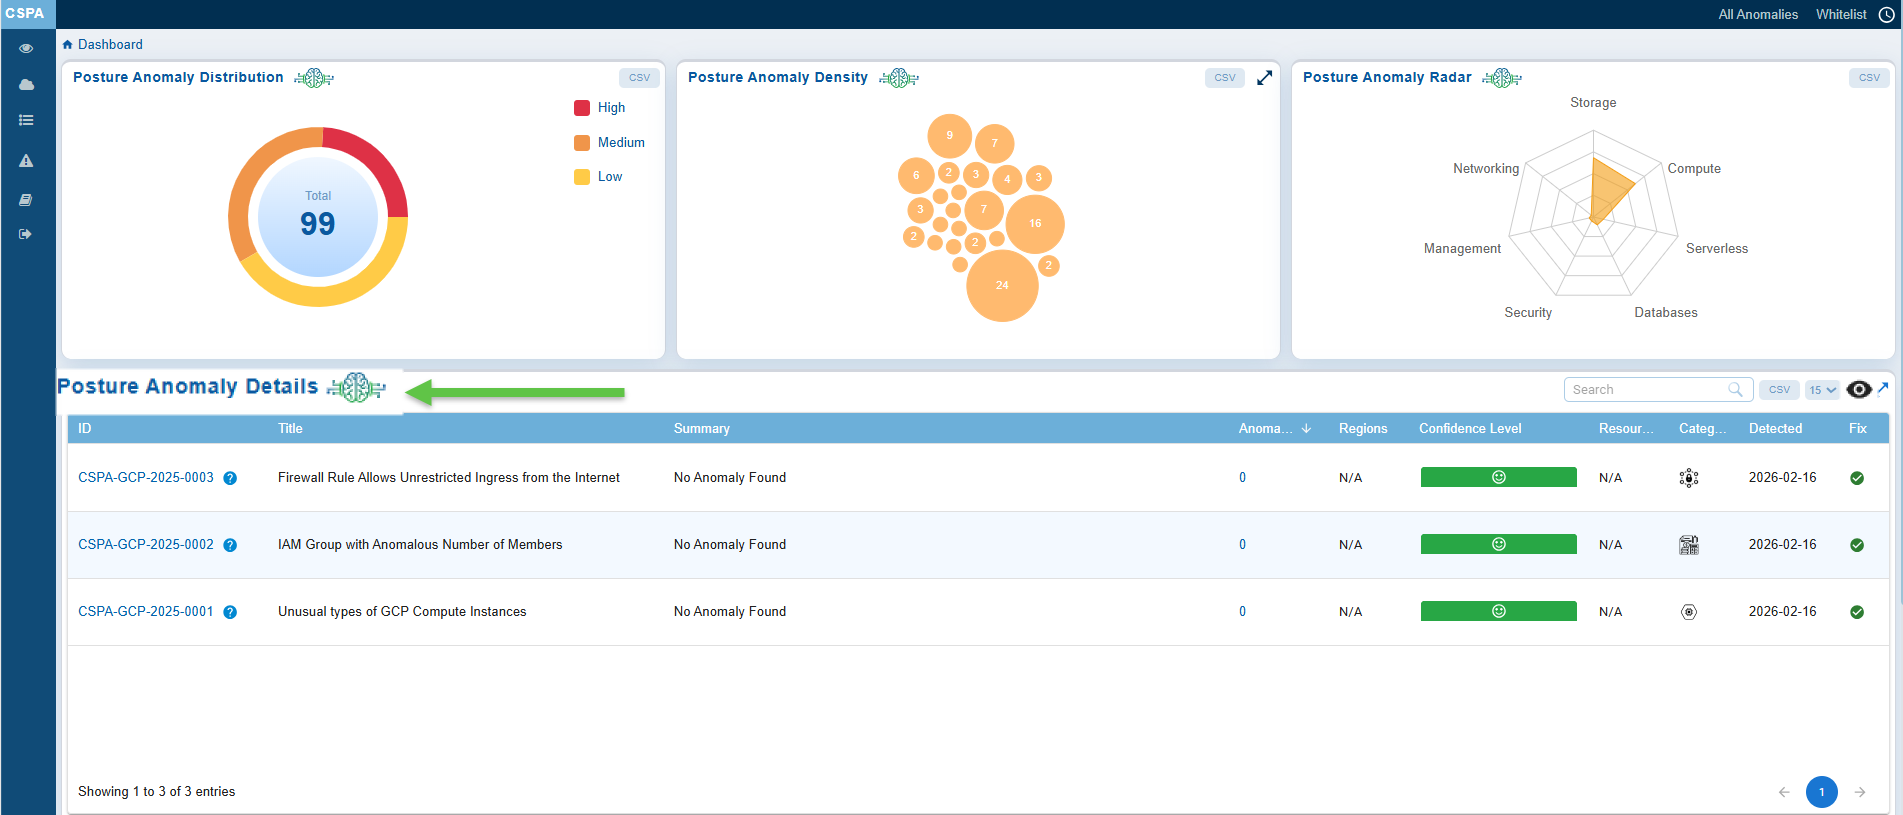
- Assess the system’s confidence level in determining if a detected issue or misconfiguration poses a risk: The Posture Anomaly Distribution view on the Saner CSPA dashboard summarizes the total count of all detected anomalies and classifies each detected anomaly into high, medium, or low confidence.
- Analyze, prioritze, and address misconfigurations or vulnerabilities across the different resource categories. From the Posture Anomaly Radar, see the count of anomalies in a specific resource category.
- View the security posture of cloud environments, displayed in a column format. This column layout helps prioritize fixes based on confidence levels, the number of affected resources, and severity. It also highlights areas that may violate regulatory requirements, such as lacking multi-factor authentication (MFA) or having outdated credentials. Additionally, the details view emphasizes specific issues that could disrupt services or introduce vulnerabilities. Finally, it provides regional insights to ensure that anomalies are addressed in geographically critical areas.
- Get a visual representation of all the anomalies detected in the Saner Cloud account as well as the anomalies that are normalized(remediated)
With the Whitelist functionality, exclude certain checks or rules during a cloud security scan for several valid reasons and view the whitelisted IDs from the Posture Anomaly Details section on the dashboard.
Salient Highlights
AI Assistant Integration
The summarization grid in the various dashboards enables the AI assistant to retrieve responses related to the relevant data.
By clicking the green icon within the summarization grid, the AI assistant dynamically fetches and displays the summary in a tooltip within the dashboard.
Posture Anomaly Confidence Levels
- Assess the system’s confidence in determining whether a detected issue or misconfiguration poses a risk
- The Posture Anomaly Distribution view summarizes all detected anomalies and categorizes them into high, medium, or low confidence levels
Anomaly Analysis and Prioritization
- Analyze and prioritize misconfigurations and anomalies across different resource categories
- Use the Posture Anomaly Radar to view the count of anomalies within specific resource categories
Security Posture Visualization
Cloud environment security posture is displayed in a column format for easy prioritization of fixes.
- Columns provide insights into:
- Confidence levels and severity of anomalies
- Number of affected resources
- Violations of regulatory requirements, such as missing multi-factor authentication (MFA) or outdated credentials
- Regional insights highlight geographically critical areas for anomaly remediation
Detailed Issue Insights
- Emphasizes specific issues that could disrupt services or introduce vulnerabilities
- Identifies violations of compliance requirements and areas needing immediate attention
Anomaly Visualization
Get a visual representation of all detected anomalies, including anomalies that have been normalized (remediated).
Whitelist Functionality
- Exclude specific checks or rules during cloud security scans for valid reasons
- View whitelisted IDs in the Posture Anomaly Details section for easy reference
Explore the Dashboard Views
| Component | What it Conveys? |
|---|---|
| Posture Anomaly Distribution | The Posture Anomaly Distribution assesses the system’s confidence level in determining if a detected issue or misconfiguration poses a risk. Each detected anomaly is classified as high, medium, or low confidence: — High Confidence: indicates that most anomalies are significant and require immediate attention. — Medium Confidence: suggests that some anomalies need further validation or investigation. — Low Confidence: refers to minor anomalies, which may involve less critical issues or potential false positives. The Posture Anomaly Distribution view on the Saner CSPA dashboard summarizes the following: Total Anomalies: The total count of all detected anomalies. Breakdown of Anomalies: Anomalies are categorized based on a machine learning algorithm threshold or through pre-assigned severity levels. This means that Saner CSPA is almost certain that these anomalies represent legitimate risks: — Red: High confidence anomalies. For example, Publicly accessible S3 bucket containing sensitive information, Misconfigured IAM roles with over-permissive policies exposing critical systems — Orange: Medium confidence anomalies. For example, Unusual but authorized use of privileged accounts, A resource not encrypted where encryption is recommended but not required — Yellow: Low confidence anomalies. For example, Access from an unusual IP address that aligns with a known employee’s travel, Temporary policy change flagged as non-compliant but corrected soon after. This breakdown helps prioritize actions, making sure that critical issues are addressed first while allocating appropriate resources to less critical ones. |
| Posture Anomaly Density | Posture Anomaly Density helps quickly identify clusters or areas with concentrated security posture issues for further prioritization and remediation. Saner CSPA dashboard presents data in bubble chart visualization with each circle representing a group of anomalies. The size of the circle corresponds to the volume of anomalies in that category. Clicking on the chart navigates you to the Posture Anomaly Parameters, providing the details of the anomaly such as ID, Title, and the number of Resources that have an anomaly. Additionally, you have an option to export the data into a CSV file. |
| Posture Anomaly Radar | Posture Anomaly Radar in cloud security helps analyze, prioritize, and address misconfigurations or vulnerabilities across the different resource categories. Saner CSPA dashboard highlights the resource categories that have the most significant posture anomalies across: — AWS include: Security, Identity and Compliance, Compute(Management &Governance, and Networking &Content Delivery) — Azure include: Compute, Resource Management, Monitoring, and Security — GCP include: Compute, DataAnalytics, Storage, Management, Databases, Analytics, Security, Functions, Networking, and Database Hover your mouse on the radar to see the count of anomalies in a specific resource category. Additionally, you have an option to export the data into a CSV file. |
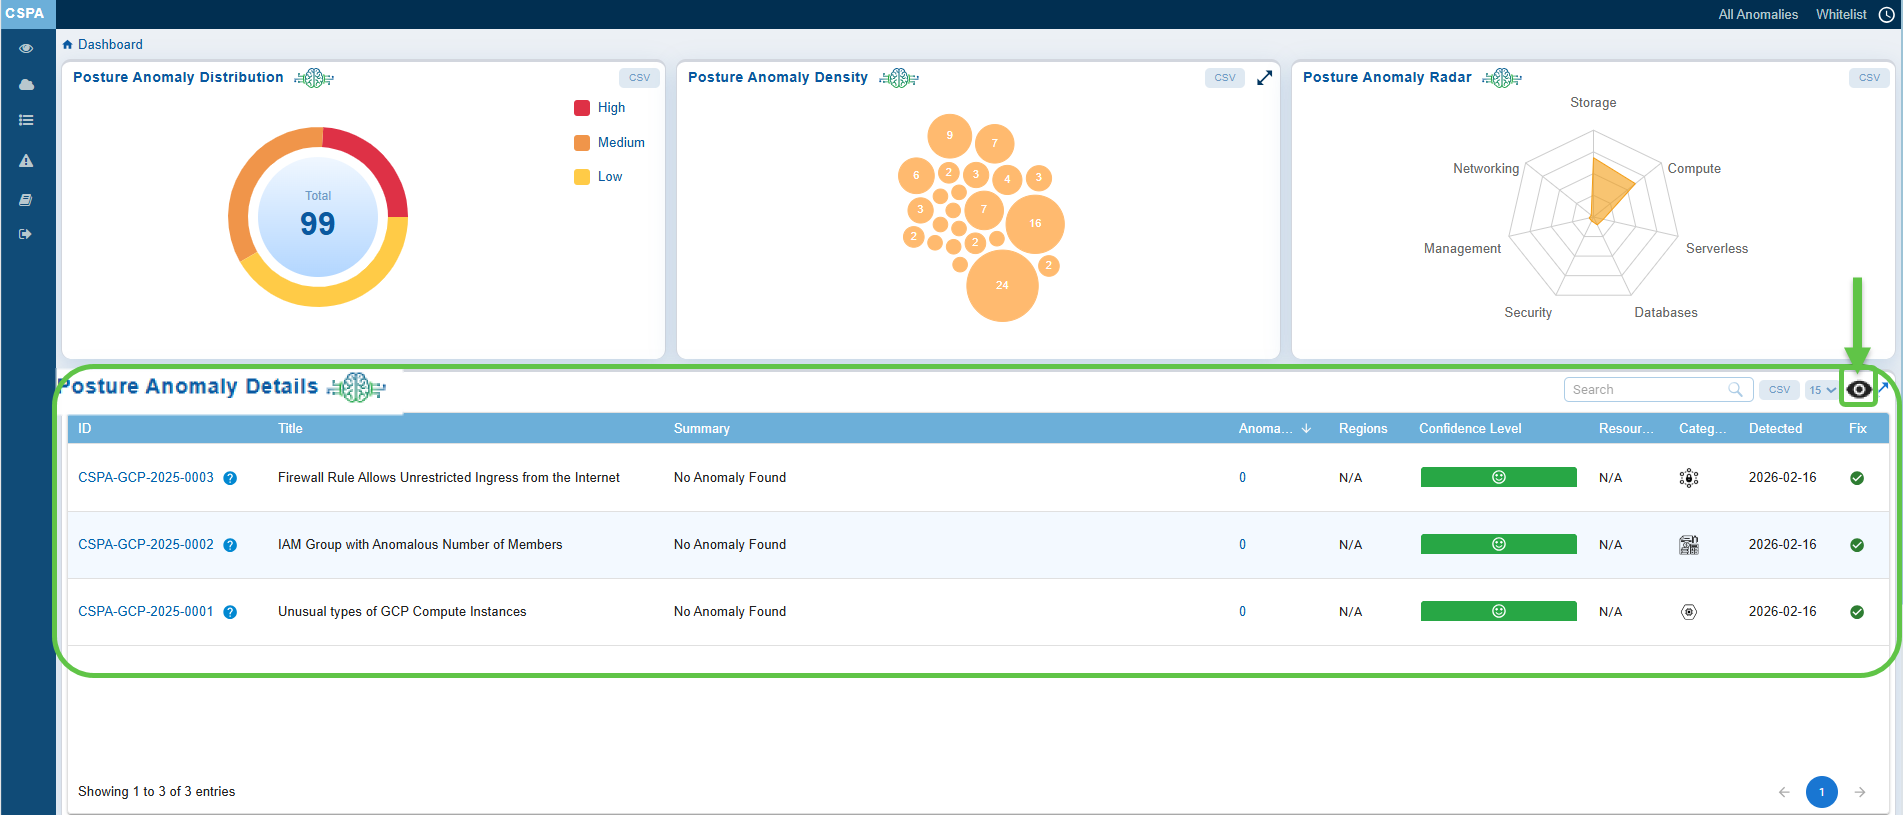
| Posture Anomaly Details | Posture anomalies refer to misconfigurations, policy violations, or deviations from best practices that could expose cloud environments to risks and result in data breaches, downtime, and more. The “Posture Anomaly Details” visualization in Saner CSPA dashboard offers a comprehensive view of the security posture of cloud environments, displayed in a column format. This layout helps prioritize fixes based on confidence levels, the number of affected resources, and severity. It also highlights areas that may violate regulatory requirements, such as lacking multi-factor authentication (MFA) or having outdated credentials. Additionally, the details view emphasizes specific issues that could disrupt services or introduce vulnerabilities. Finally, it provides regional insights to ensure that anomalies are addressed in geographically critical areas. Here’s a breakdown of what the columns represent: ID: Unique tracking reference for each posture anomaly detection rule (for example, CSPA-AWS-2023-0004) that helps identify, categorize, and retrieve specific records within the platform. Each ID follows a structured format that indicates it is a Cloud Security Posture Anomaly, includes the associated cloud provider(AWS, Azure, or GCP), the year of detection, and a sequential number. Title: Describes the specific issue identified (For example, “Finds Groups with lesser instances” or “Finds IAM User with active password but no MFA”) that provides insight into what kind of misconfiguration or anomaly is being detected. Summary: Indicates the total number of resources evaluated and the count of anomalies identified. For example, “22 instances of resources are checked, of which 11 are found to have anomalies”. Profile: Specifies the cloud service under which the anomaly was detected (for example, aws account). Region: Highlights the number of regions affected by the anomaly. Useful for assessing the geographical spread of the issue. Confidence Level: Indicates the system’s confidence level in determining if a detected issue or misconfiguration poses a risk. Anomalies are categorized based on a machine learning algorithm threshold or through pre-assigned severity levels. This means that Saner CSPA is almost certain that these anomalies represent legitimate risks: — Red: High confidence anomalies. Indicates the count of anomalies that are significant and require immediate attention. — Orange: Medium confidence anomalies. Suggests the count of anomalies that need further validation or investigation. — Yellow: Low confidence anomalies. Refers to the count of minor anomalies, which may involve less critical issues or potential false positives. This breakdown helps prioritize actions, ensuring that critical issues are addressed first while allocating appropriate resources to less critical ones. Resources: Lists the number of affected resources associated with the anomaly. Category: Classifies the anomaly (for example, security or governance-related). Detected: Timestamp when the anomaly was identified (for example., 2024-12-17). Fix: Implies action or recommendations to resolve the anomaly (indicated by a wrench icon). By following the link under “ID” column or on clicking the “more” link under Summary column, users can access additional details about the anomaly that includes: a brief summary, anomaly data, anomaly status, anomaly trends over time, and region-wise mapping. Additionally, users can take various actions from the view, such as sorting or filtering, searching for keywords, selecting the number of records to view, exporting the records into a spreadsheet (CSV), turning on and off the whitelisted anomalies(eye symbol) from display, and viewing the security posture of assets(anomalous and normalized). |
| Anomaly Trends over Time | Anomaly trends over time are commonly used to monitor and manage anomalies detected in cloud infrastructure. The Saner CSPA dashboard provides a graphical representation of the count of anomalies related to misconfigurations, policy violations, or security incidents over a specific period. The data displayed on the dashboard is updated after each scan. |
| Region Wise Mapping | Region-wise mapping in cloud posture provides a geographical perspective on the security posture of cloud environments. The “Region Wise Mapping” visualization on Saner CSPA dashboard displays the total number of affected regions and anomalies on a world map and helps understand the distribution of resources across the cloud. The dots indicate the specific regions with anomalies. By moving your cursor over the dots, you can pin-point anomalies or vulnerabilities specific to regions. |
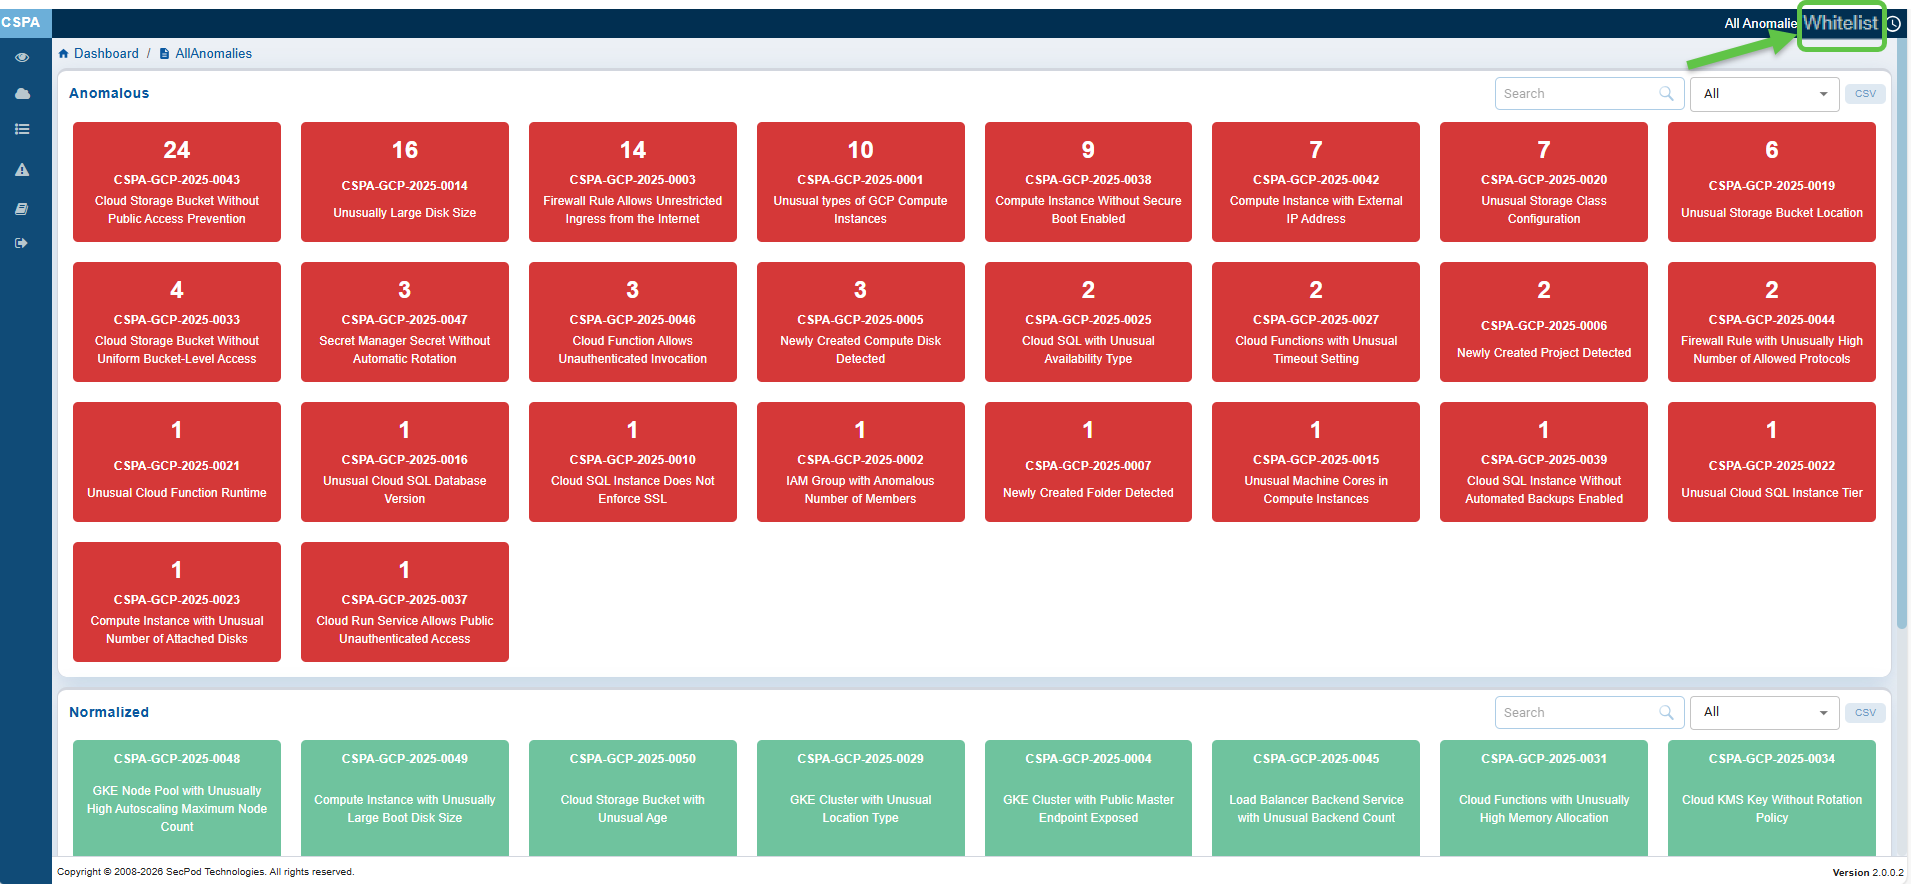
| All Anomalies | The “All Anomalies” in Saner CSPA offers a visual representation of both anomalous and normalized(remediated) anomalies in the Saner Cloud account. The red tiles highlight critical issues that require immediate attention, while the green tiles provide assurance about resource categories that are not problematic. Anomalous data is displayed in red tiles, with each tile representing a specific category of detected anomaly in the cloud environment. Each red tile includes the following information: — Anomaly ID (for example, CSPA-AWS-2024-0078) — A brief description of the anomaly (for example, “frequent CloudTrail console login events”) — A count displayed on each tile that indicates the number of anomalies for the specific rule Green tiles represent normalized data, indicating instances of conditions that aren’t flagged as anomalous. Additionally, users can take various actions from the page such as, searching for keywords, viewing the anomalies under specific groups(such as Compute, Management, Analytics, or All), and exporting the records into a spreadsheet (CSV). |
| Whitelist | Sometimes, it’s necessary to exclude certain checks or rules during a cloud security scan for several valid reasons. Below are some common scenarios and how to handle them using Saner CSPA. 1. A rule may flag an issue that is irrelevant to a specific environment. For instance, a rule might identify an S3 bucket as publicly accessible, but this might be intentional to host a public website. 2. Not all checks are applicable to every environment or project. For example, a check enforcing multi-factor authentication (MFA) for all IAM users might not be relevant if the organization exclusively uses federated access. 3. Legacy systems or older architectures might not support certain security best practices or compliance requirements. For example, a legacy application may utilize outdated encryption protocols that cannot be updated immediately. Saner CSPA provides a way to assess and exclude these anomaly ids from the scan. To whitelist anomalies, simply click the Whitelist link on the CSPA dashboard. Select the IDs you wish to whitelist by checking the corresponding checkbox(es), then click Save. On the other hand, you can whitelist individual resources from the Posture Anomaly Details page. Just click the individual id on the Whitelisting page and navigate to the Anomaly details page for further action. You can view the whitelisted IDs from the Posture Anomaly Details section on the dashboard by clicking the eye icon. |
Learn How To
How to View Anomaly Distribution Across Cloud Providers at Organization-level?

From the Organization-level Dashboard, you can view the distribution of anomalies across the different cloud providers(AWS, Azure, or GCP). The bar stack chart format provides a clear visual representation that helps address critical issues first while allocating appropriate resources to less critical ones.
Steps to View Anomaly Distribution:
Step 1: Navigate to the Organization-Level Dashboard.
Step 2: Go straight to the Anomaly Distribution view.
Step 3: Examine the chart to understand how anomalies are distributed across the the different cloud providers: AWS, Azure, and GCP.
How to View Anomaly Trend Across Cloud Providers at Organization-level?
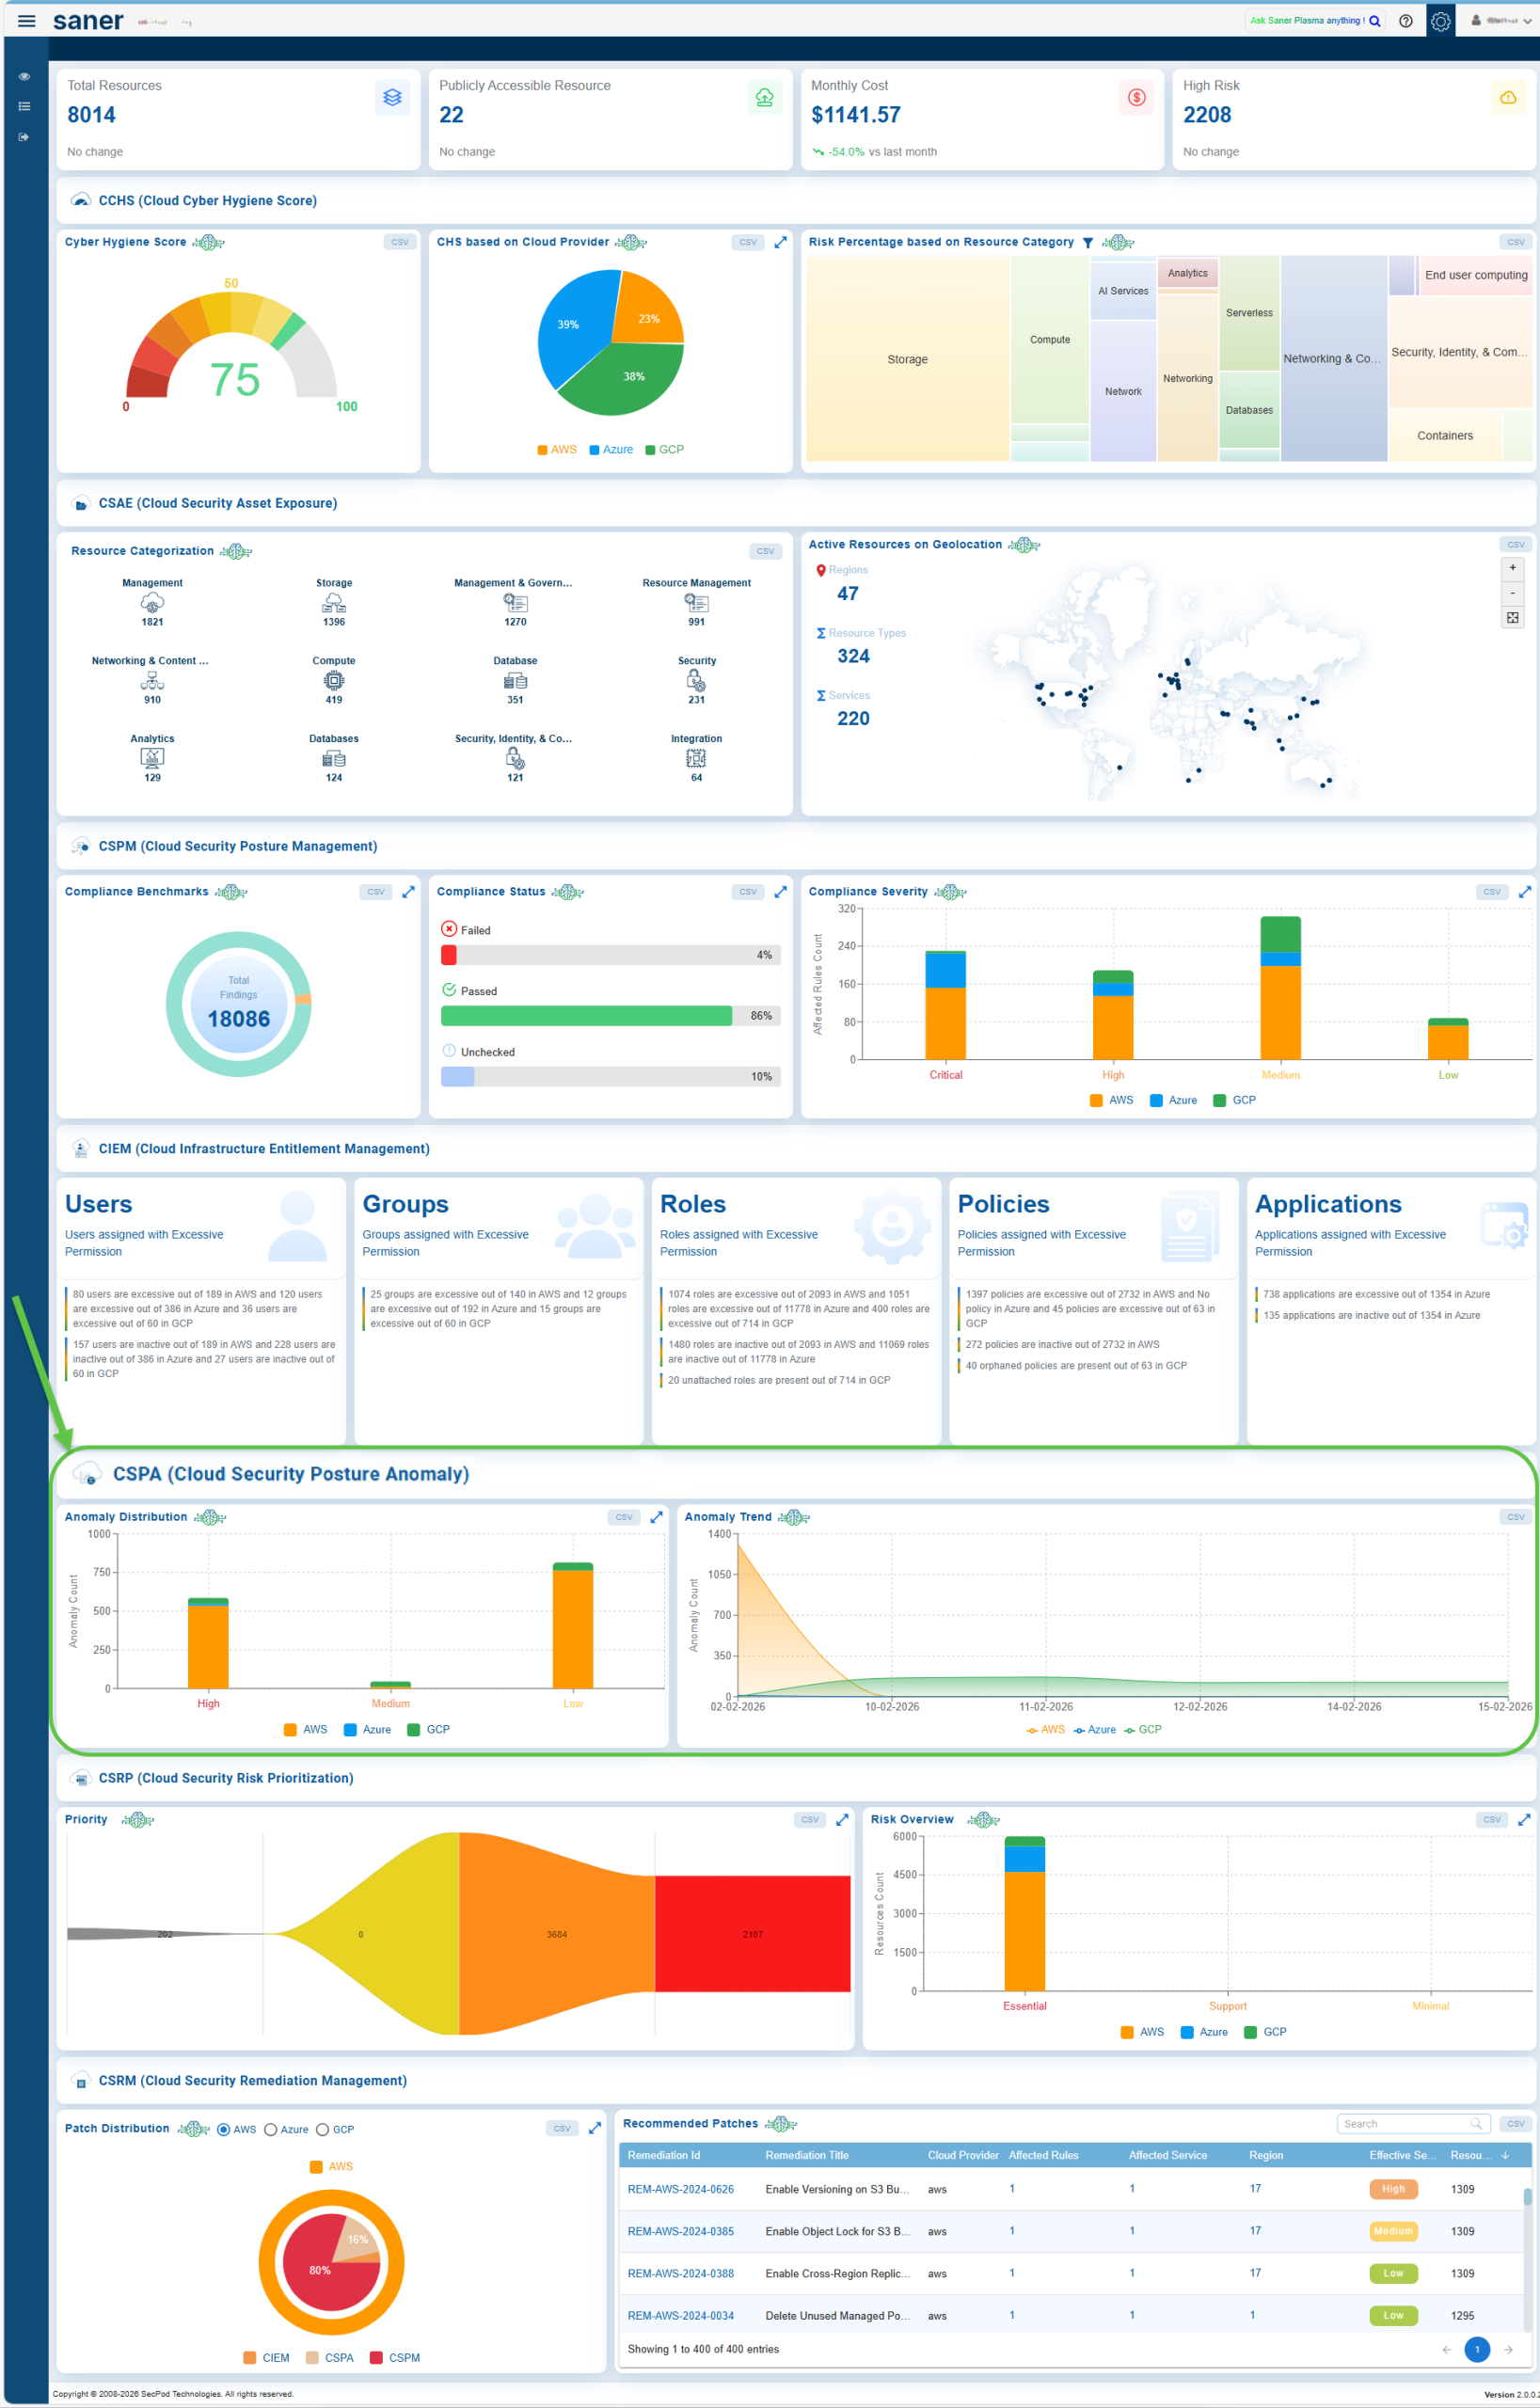
From the Organization-level dashboard, you can view the Anomaly trends across the different cloud providers(AWS, Azure, or GCP). The “Anomaly Trends” graphical visualization provides a count of anomalies related to misconfigurations, policy violations, or security incidents over a specific period. The data displayed is updated after each scan.
Steps to View Anomaly Trend over time:
Step 1: Navigate to the Organization-Level Dashboard.
Step 2: Go stratight to the Anomaly Trend view.
Step 3: Examine the chart to understand how anomalies are distributed across the the different cloud providers: AWS, Azure, and GCP over different time period.
How to Prioritize Remediation or Fixes based on Confidence Levels?
Determine if a Detected Issue or Misconfiguration Poses a Risk…
Confidence Level indicates if the system is certain in determining if a detected issue or misconfiguration poses a risk.
Anomalies in Saner CSPA are categorized based on a machine learning algorithm threshold or through pre-assigned severity levels. This means that the system is almost certain that these anomalies represent legitimate risks:
— Red: High confidence anomalies. Indicates that most anomalies are significant and require immediate attention.
— Orange: Medium confidence anomalies. Suggests that some anomalies need further validation or investigation.
— Yellow: Low confidence anomalies. Refers to minor anomalies, which may involve less critical issues or potential false positives.
This breakdown helps prioritize actions, ensuring that critical issues are addressed first while allocating appropriate resources to less critical ones.
Look into the Confidence Level to make informed decisions from the:
— Posture Anomaly Details view within the CSPA dashboard
— Posture Anomaly Distribution(High, Medium, and Low) on the CSPA dashboard
How to Quickly Identify the Detected and Remediated Anomalies for an Account?
Anomalies Indicated by Color Codes

The “All Anomalies” in Saner CSPA offers a visual representation of all the anomalies detected in the Saner Cloud account as well as the anomalies that are normalized(remediated).
Anomaly data is indicated in 2 different sections indicated by distinct color codes:
— Red: highlights critical issues that require immediate attention
— Green: provides assurance about resource categories that are not problematic and remediated
Move your cursor over the tile to see more information about the Posture Anomaly(PA) ID such as:
— The number of anomalies for the specific rule
— Anomaly ID (for example, CSPA-AWS-2024-0078)
— A brief description of the anomaly (for example, “frequent CloudTrail console login events”)
Click on the Red tile to navigate to the Posture Anomaly Details page. You have an option to remediate all the anomalies within the relevant PA ID by clicking the wrench icon.
How to Whitelist Rules or Resources in Cloud Security Scans?
Overview
Sometimes, it’s necessary to exclude certain checks or rules during a cloud security scan for valid reasons.
Here’s why and and how to handle using Saner CSPA…
Why Exclude a Rule or Check?
- Irrelevant Findings: A rule might flag an issue that is intentional for your environment.
Example: An S3 bucket is flagged as publicly accessible, but this is required because it hosts a public website. - Non-Applicability: Not all checks apply to every environment or project.
Example: A check enforcing multi-factor authentication (MFA) for all IAM users is irrelevant if your organization exclusively uses federated access. - Legacy Systems: Older architectures or legacy systems might not fully support certain security best practices immediately.
Example: A legacy application might still rely on outdated encryption protocols that cannot be updated without significant effort.
How to Exclude or Whitelist “Rules” in Saner CSPA?
Saner CSPA allows you to assess and exclude specific anomaly IDs from scans. Follow these steps to whitelist anomalies:
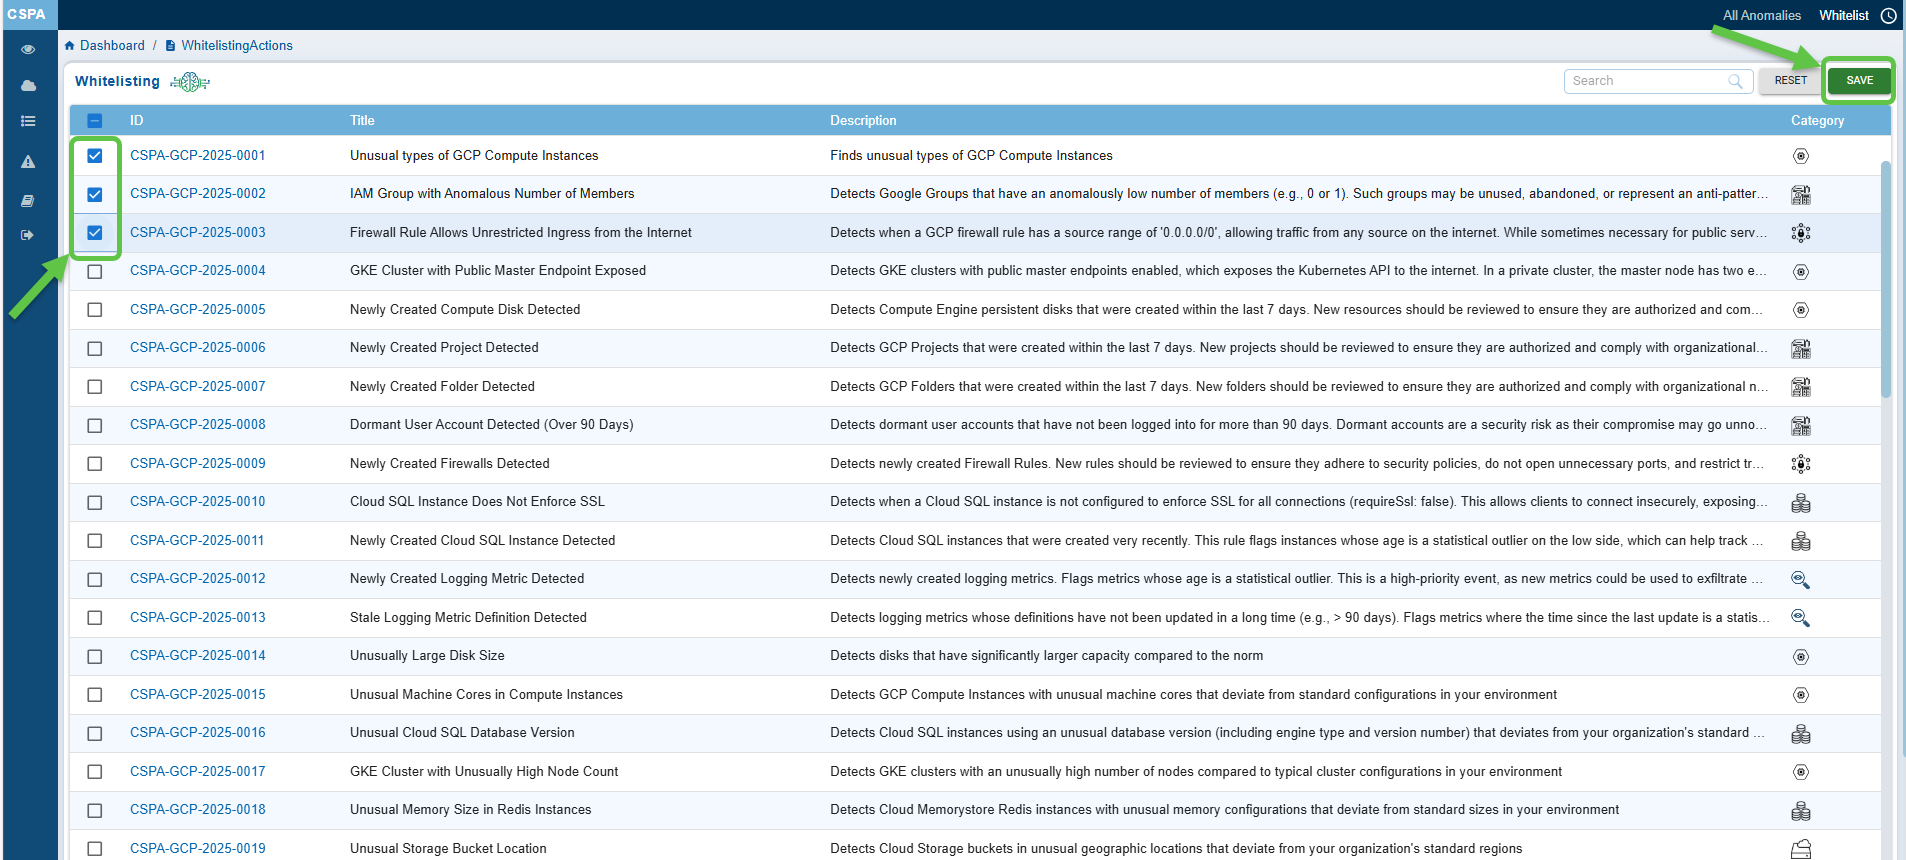
Step 1: Navigate to the CSPA dashboard.
Step 2: Click the Whitelist link on the top-right of the page.
Step 3: Select the anomaly IDs you wish to exclude by checking the corresponding checkboxes.
Step 4: Click Save to confirm your changes.
Result: The Whitelisted anomalies display in the Posture Anomaly Details block on the dashboard. Click the eye icon within the block to see the anomalies you just whitelisted.

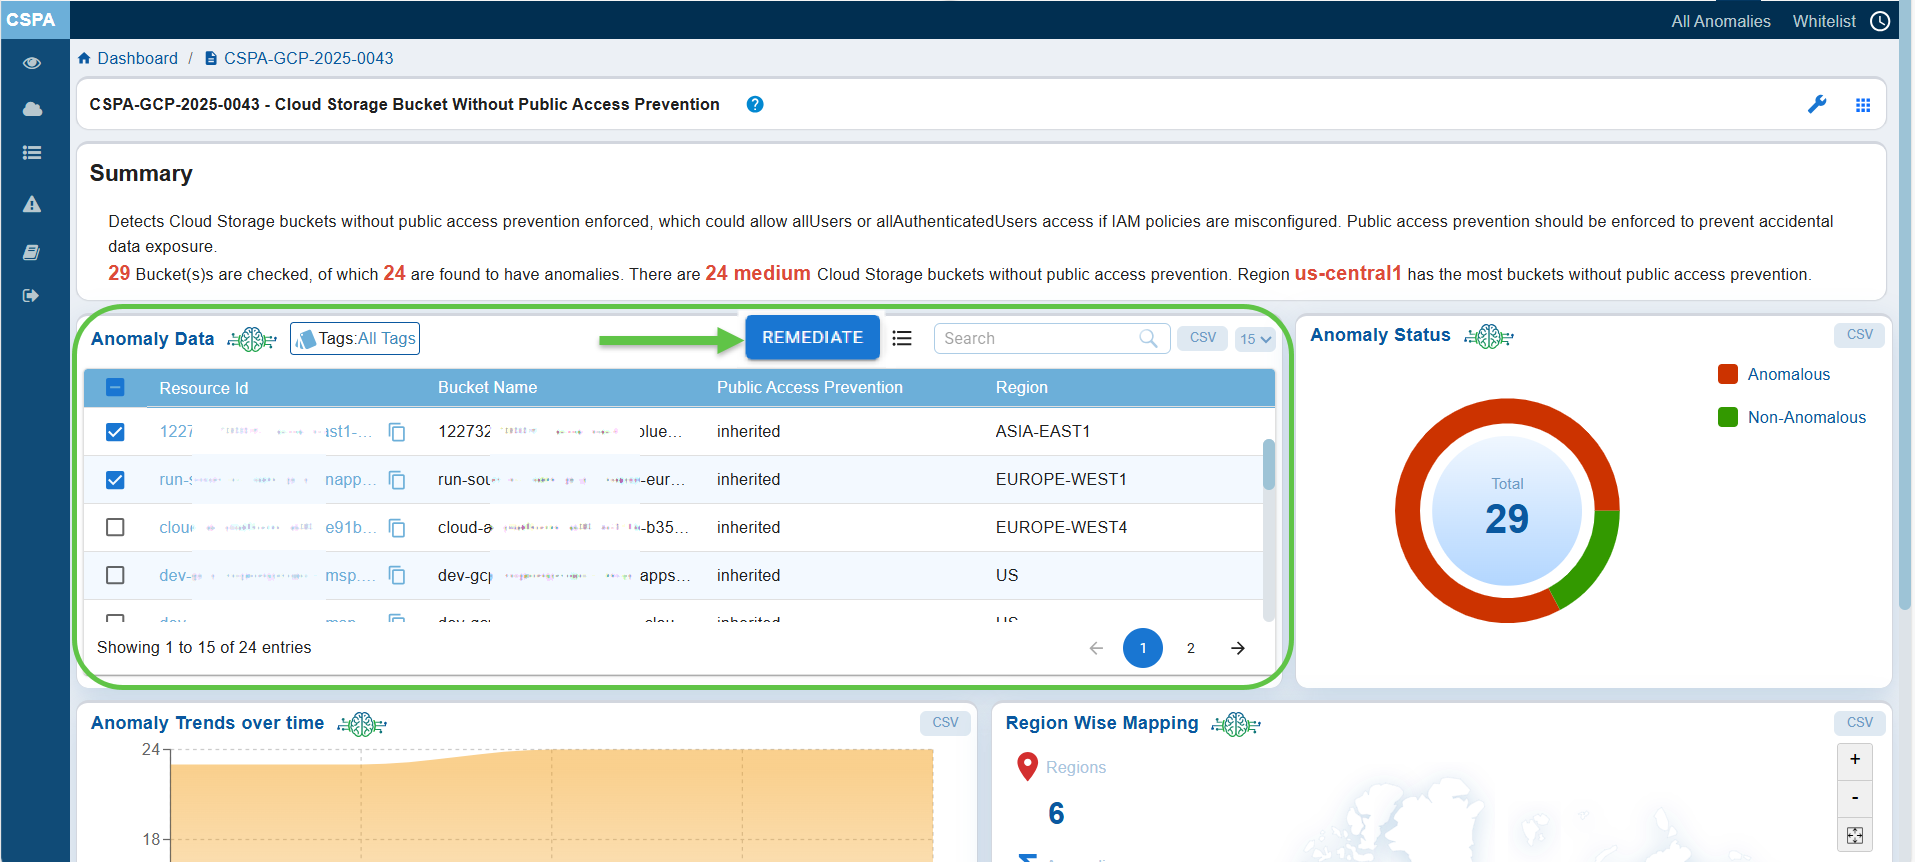
How to Exclude or Whitelist “Resources” in Saner CSPA?
Step 1: From the Posture Anomaly Details block on the dashboard, click on the ID that you want to whitelist. The Details page for that ID opens.
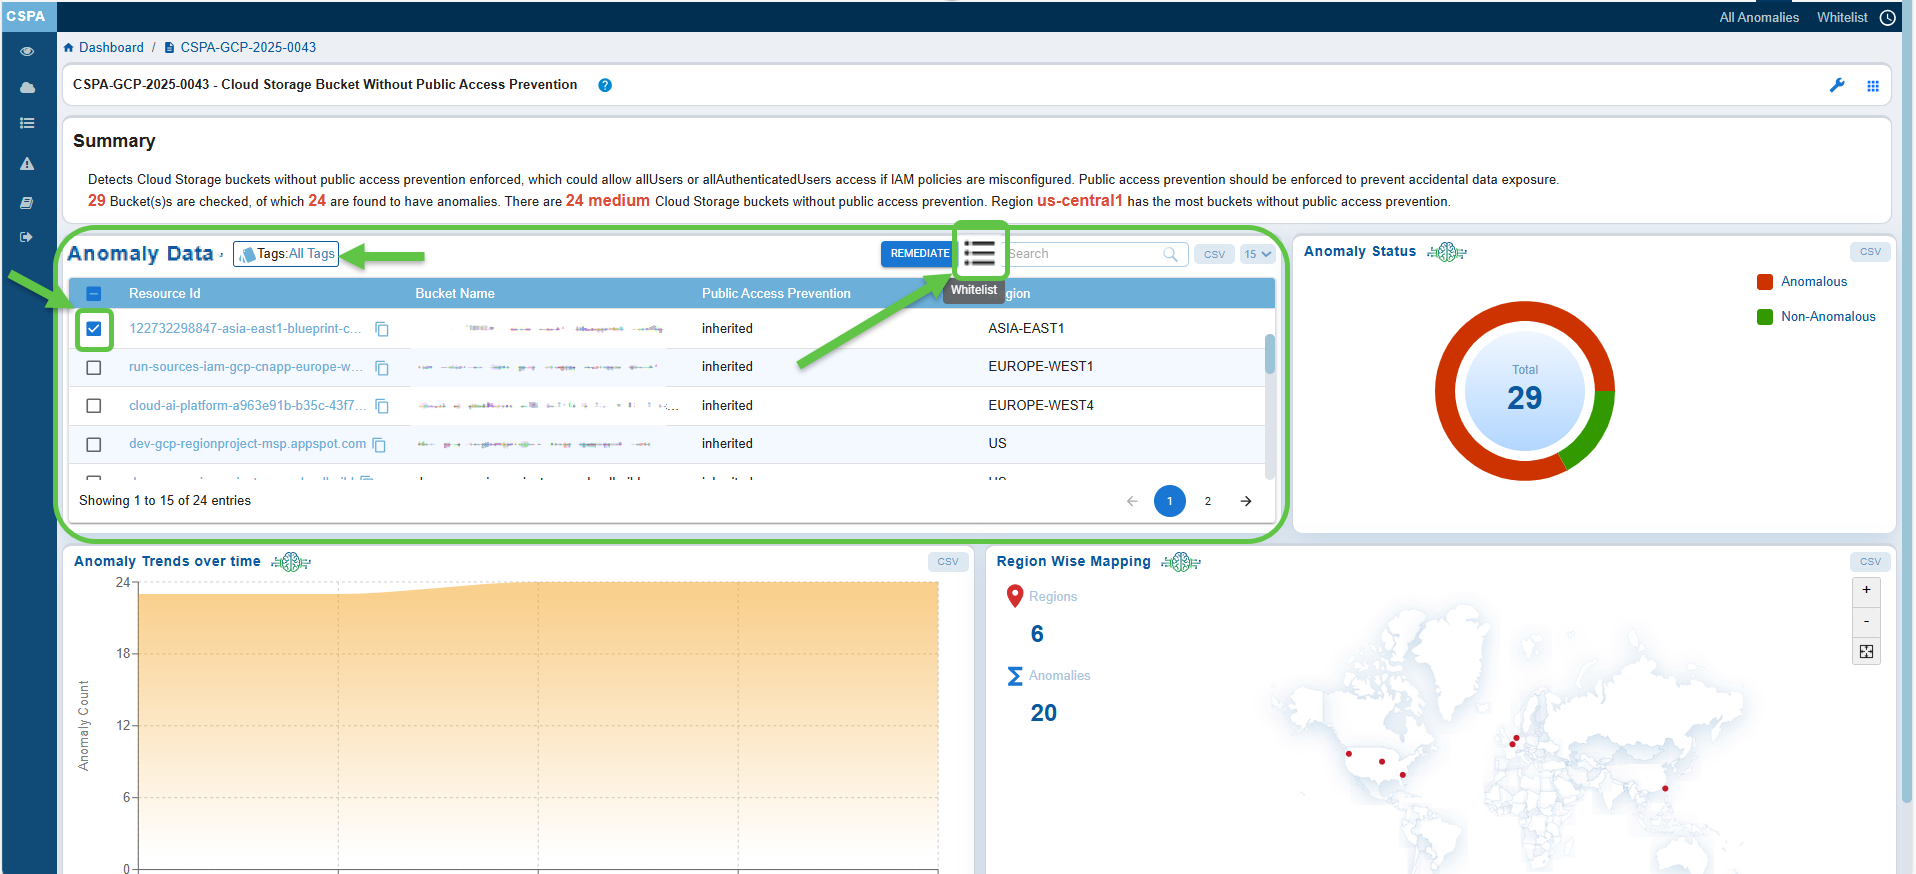
Step 2: From the Anomaly Data block on the Details page, click the checkbox to select the relevant anomaly
Step 3: Select the checkbox corresponding to the ID
Step 4: Click the Whitelist menu icon, next to the search box within the Anomaly Data block. Hover over the icon to see the name.
The Confirmation message displays prompting you to confirm if you want to whitelist the selected resources.
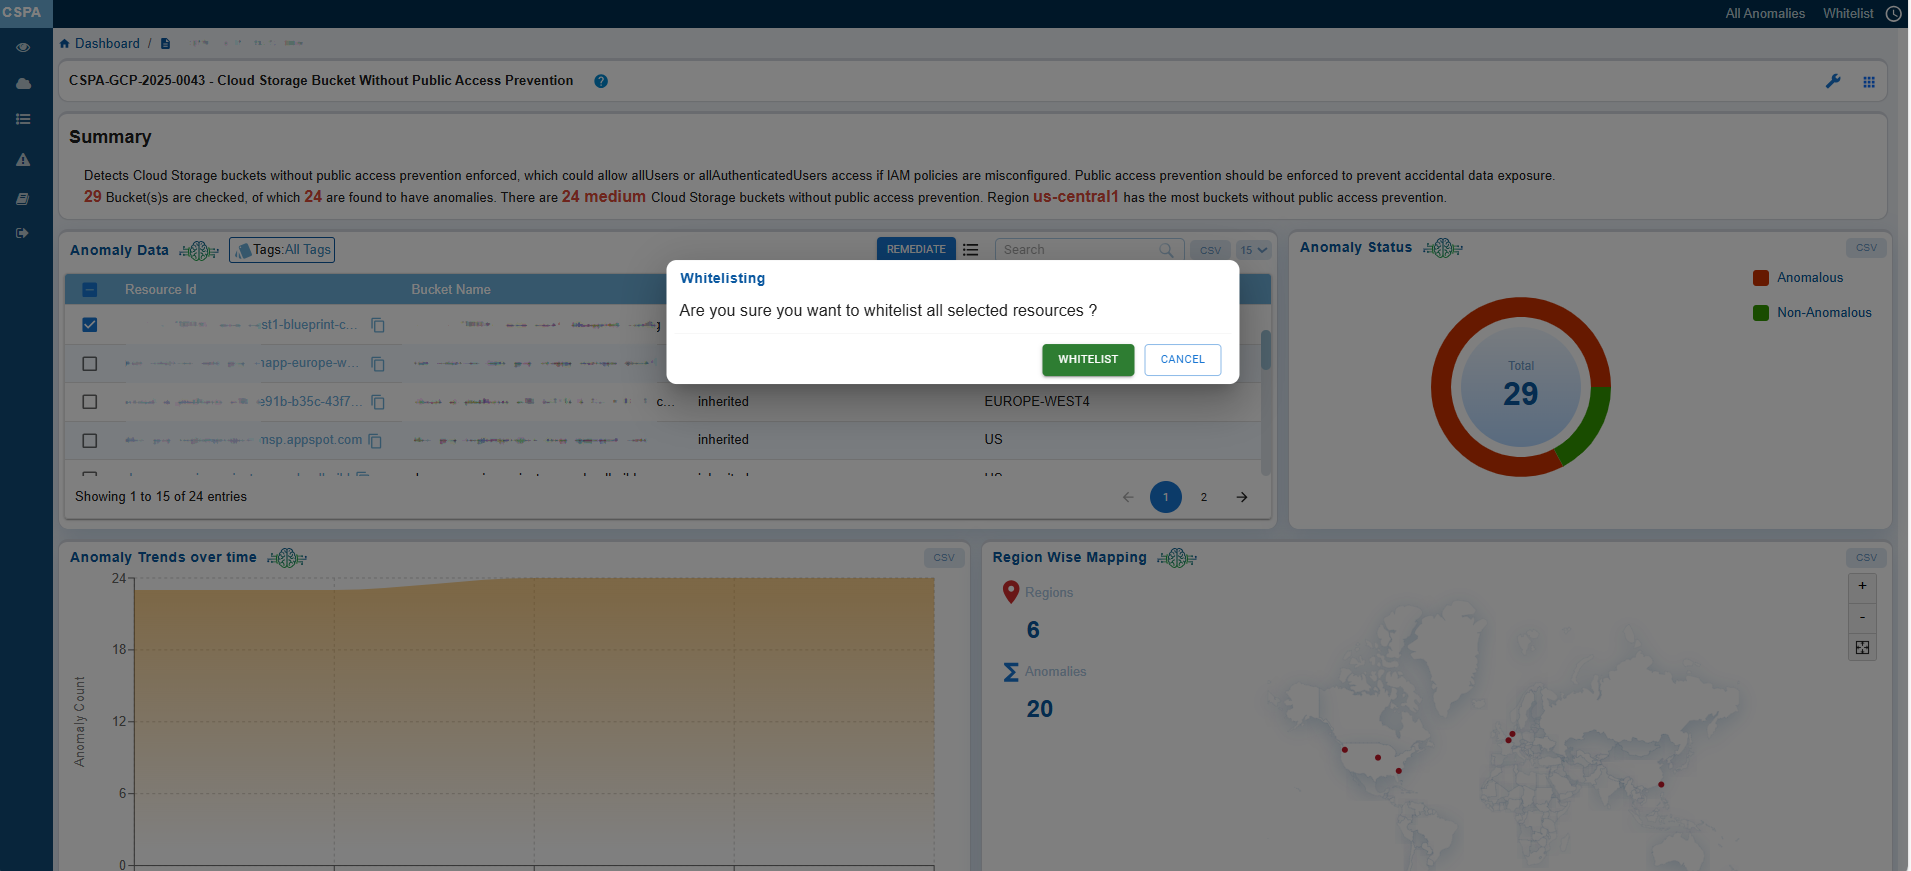
Step 5: Click the Whitelist button to confirm your selection.
Step 6: To see the whitelisted ids, click the eye icon within the Anomaly Data block. Hover over the icon to see the name.
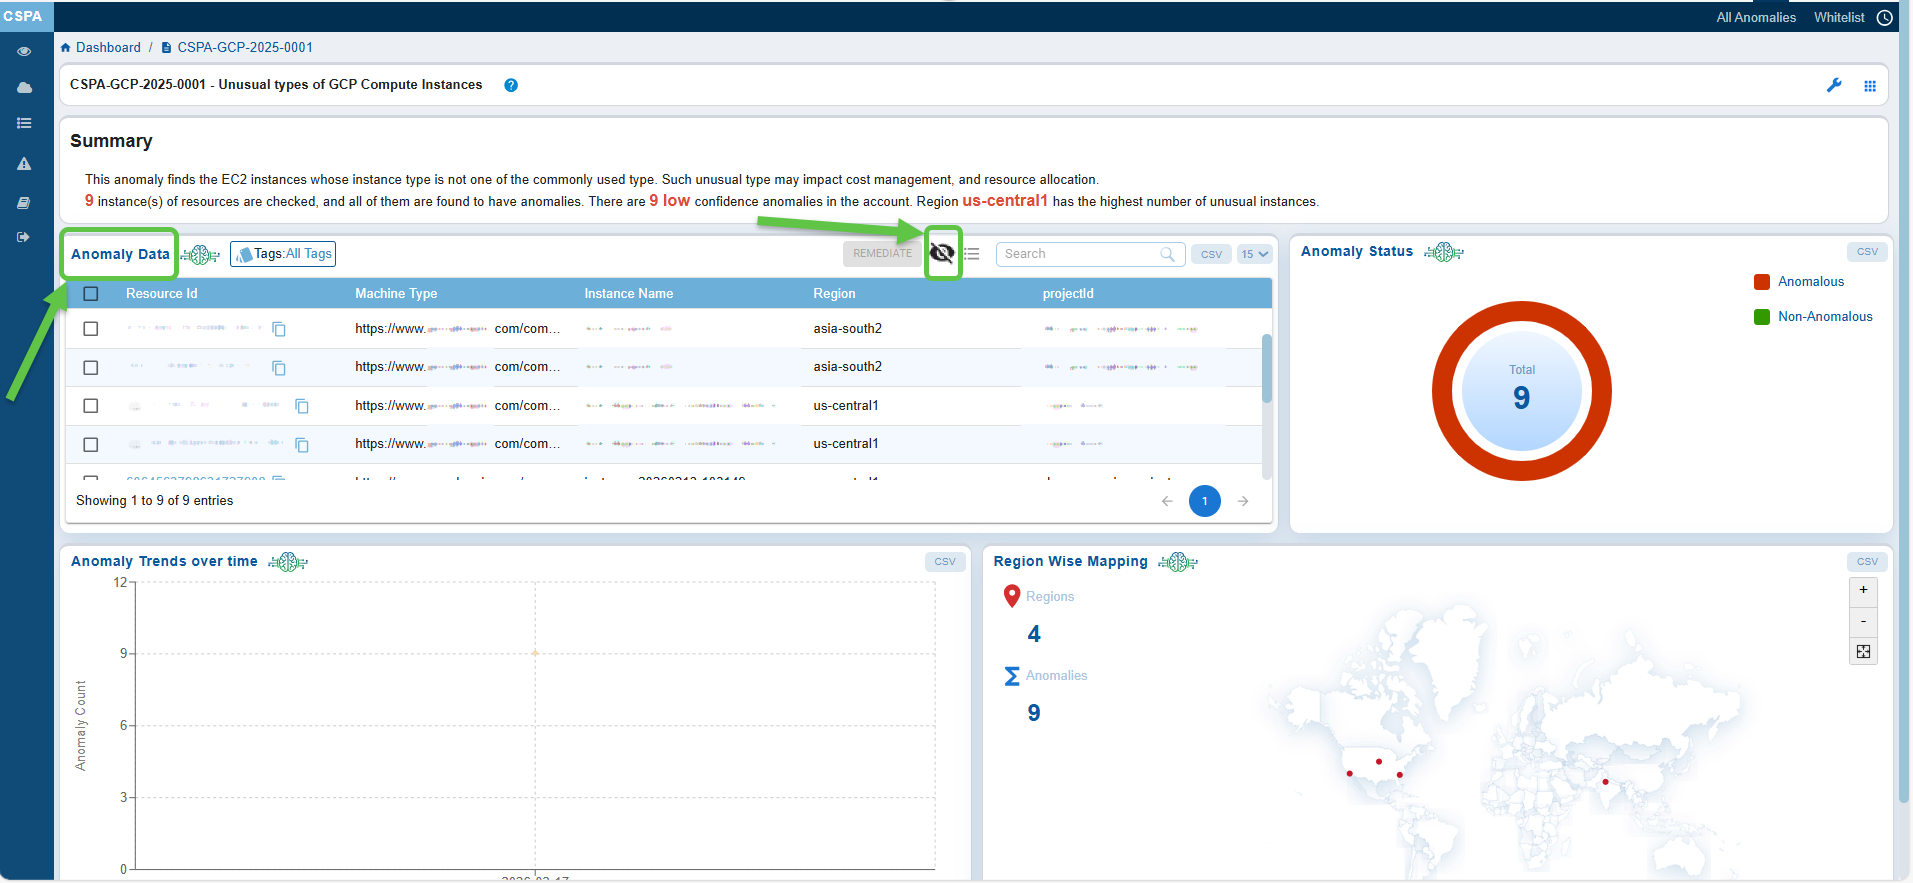
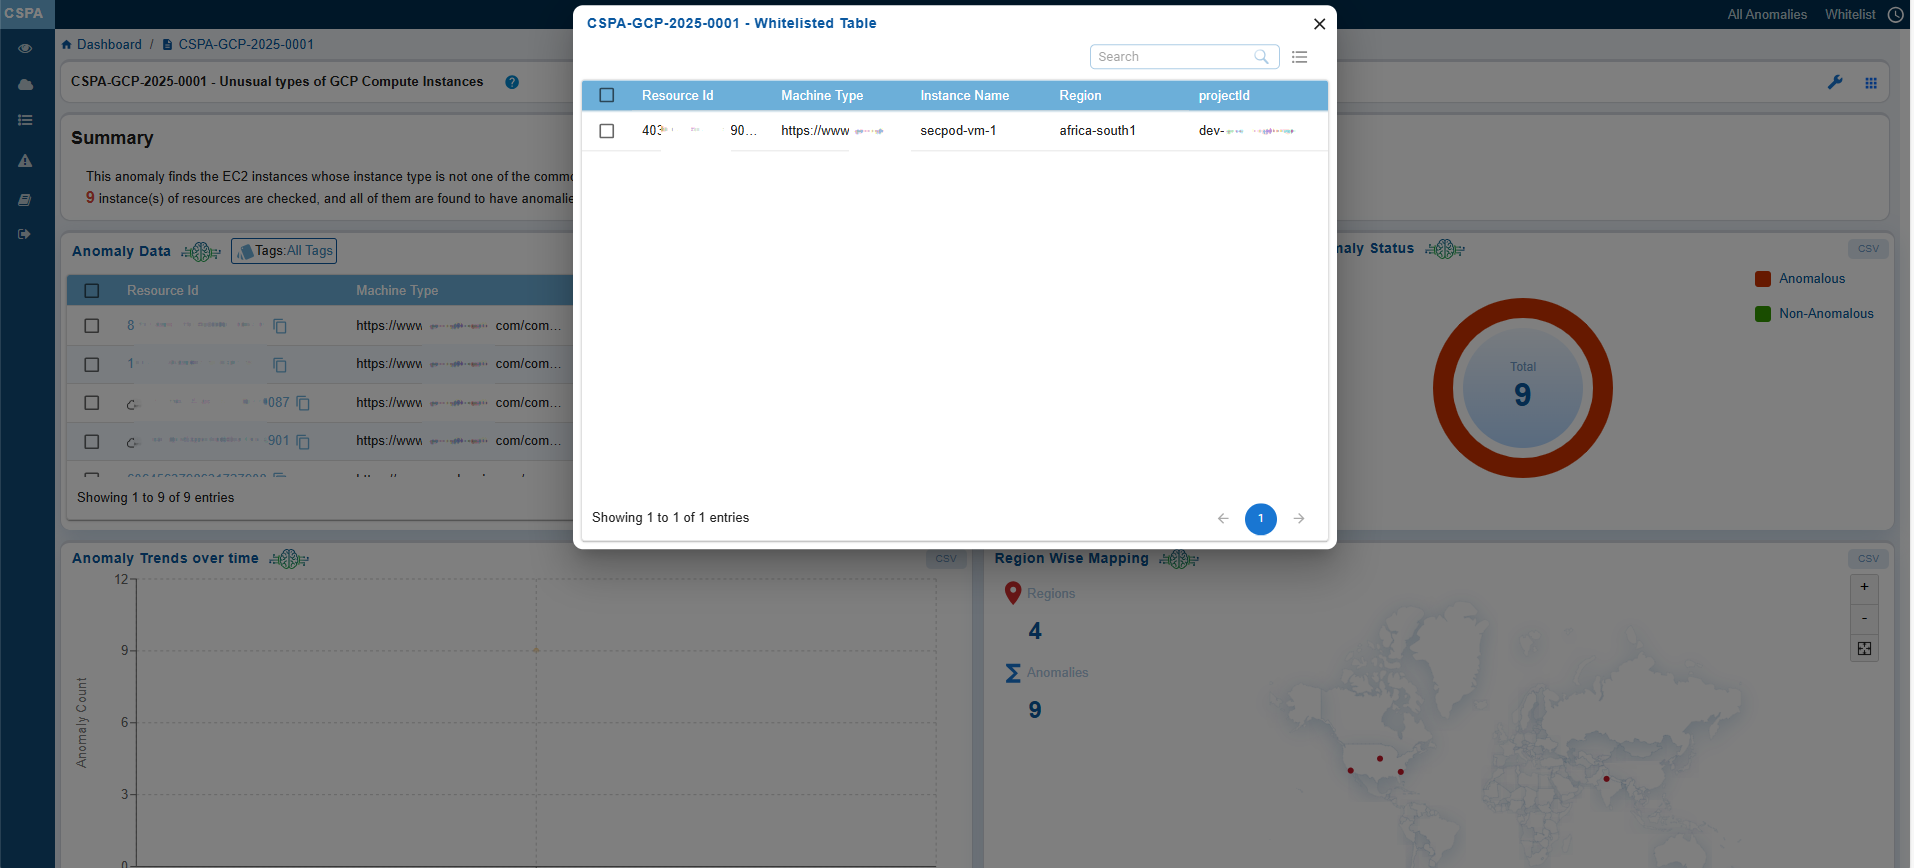
[OPTIONAL] To remove the whitelisted ids, just select the checkbox(es) and click the Remove button on the top-right next to the search box within the window.
View the Whitelisted IDs
To review the whitelisted IDs:
Step 1: Navigate to the Posture Anomaly Details section on the dashboard.
Step 2: Click the eye icon to view all the whitelisted IDs.
Alternatively, access the “All Anomalies” link on the top-right of the dashboard and search for the id you whitelisted. If the ID does not display on the page, understand that its whitelisted.
Observe the Reduction in Total Count
Take note of the current count that has reduced after excluding(whitelist) the rule/check/resource from the cloud security scan. Also observe that the whitelisted resource is not present in the “All Anomalies” page.
How to Search and Retrieve Anomaly Data?
Search and Retrieve Results
You can search for the following anomaly data by keying in the criteria and retrieve the relevant results in the dashboard view:
- Rule ID
- CSPA ID
- Profile Name
- Region
- Category
- Creation Date
- Detected Date
- Title
How to Initiate Patch Remediation from CSPA Dashboard?
Overview
Remediation of findings from Saner CSPA dashboard involves systematically addressing the anomalies by identifying and resolving risks within your AWS, Azure, or GCP account directly from the interface with ease.
Initiate the Patching Task in One of the Ways
Option1: By Accessing the Fix (Wrench) Icon from the Posture Anomaly Details Block on the Dashboard
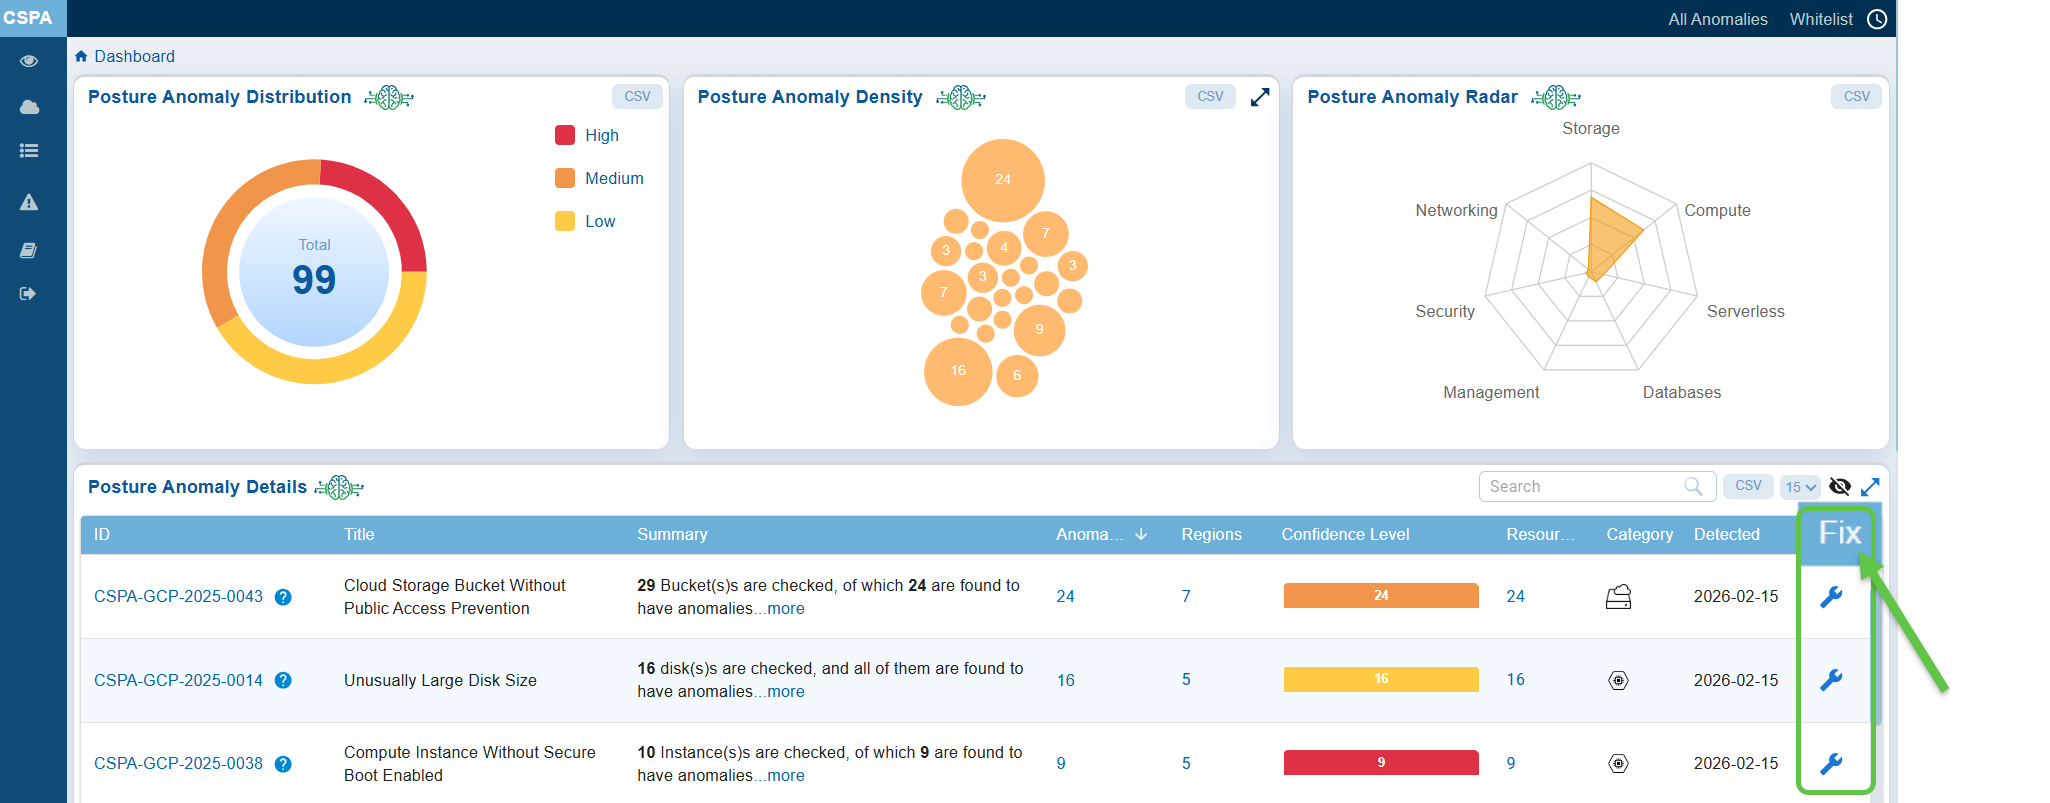
Step 1: Go straight to the Posture Anomaly Details block in the CSPA dashboard and click on the Fix (wrench) icon corresponding to an anomaly.
Step 2: Automatic Redirection to CSRM:
The application automatically redirects you to Cloud Security Resource Management(CSRM) and opens the CSPA Tabular Listing to begin the patching activity.
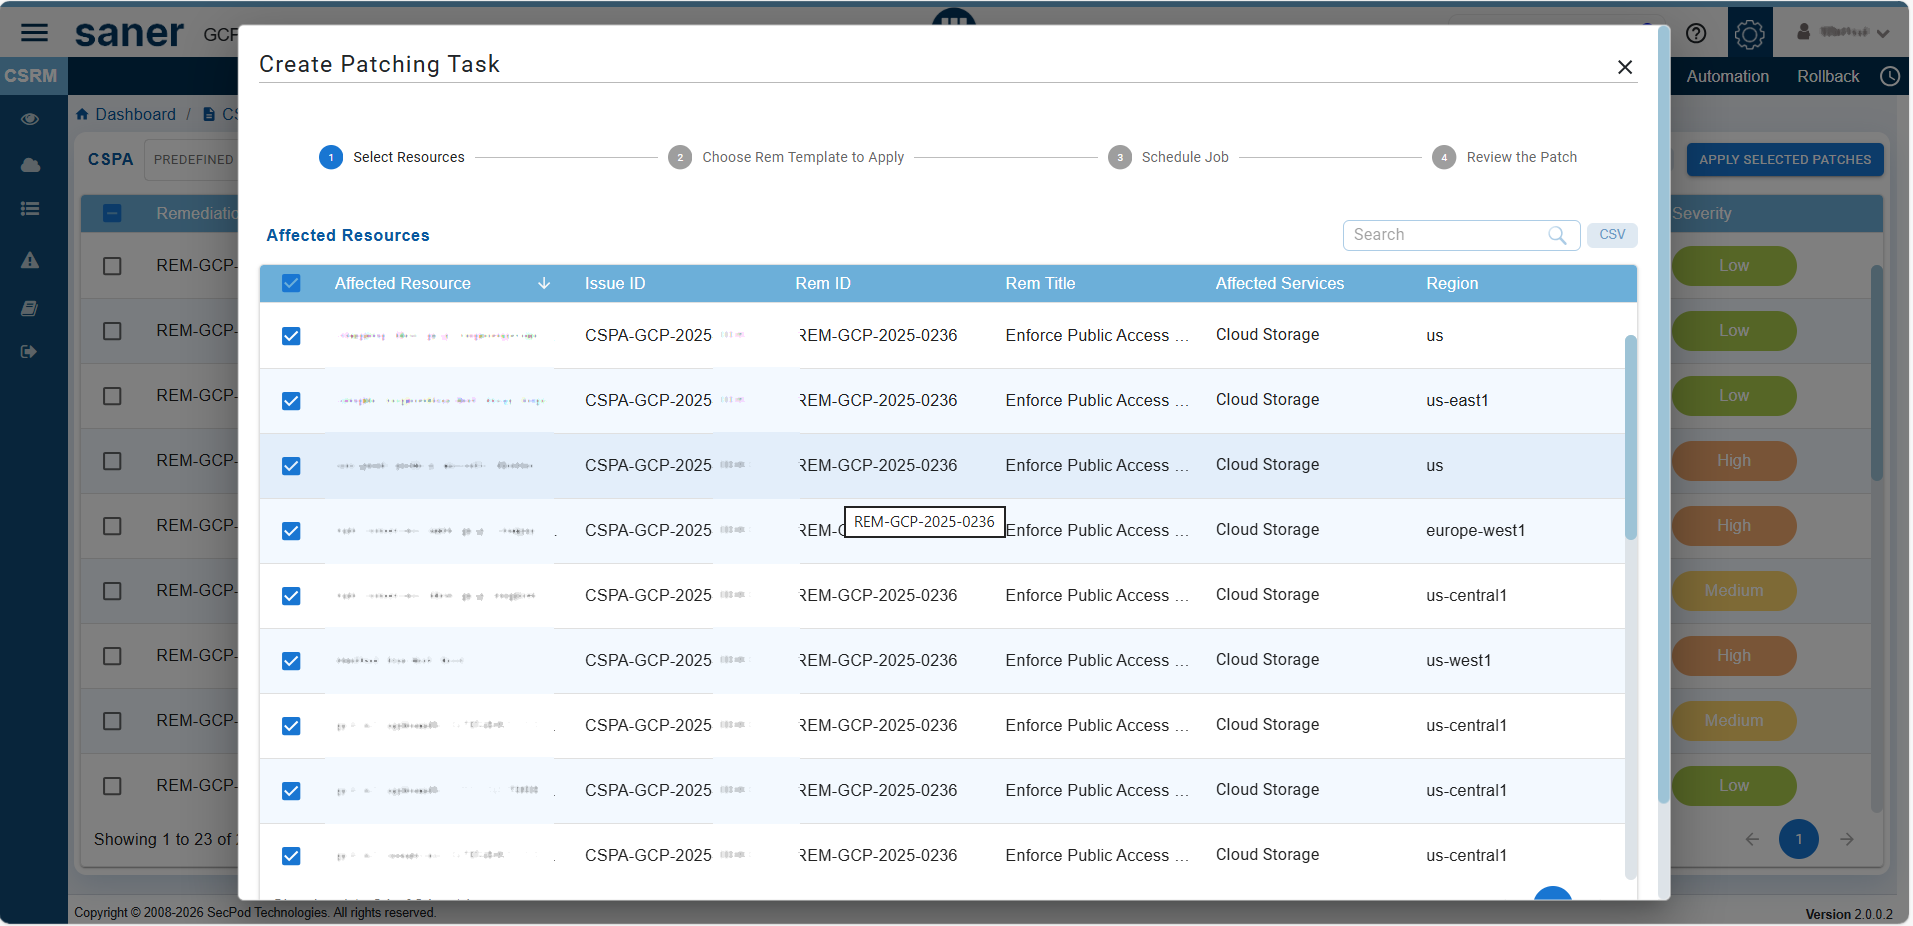
Step 3: Follow the Wizard
The wizard guides you through the process of selecting and applying the necessary patches.
Option 2: From the “Anomaly data” widget within the Anomaly ID Page
Commonly Asked Questions
How does Saner CSPA detect anomalies in my cloud infrastructure?
After completing the posture anomaly scan on a designated account, Saner CSPA does a computation on the gathered data and displays the results within the relevant views on the dashboard.
What can I infer from the Posture Anomaly Distribution View in CSPA Dashboard?
The Posture Anomaly Distribution view on the Saner CSPA dashboard summarizes the total anomalies and also categorizes anomalies based on severity levels. This breakdown helps prioritize actions, ensuring that critical issues are addressed first while allocating appropriate resources to less critical ones.
The Posture Anomaly Distribution view summarizes the following:
Total Anomalies: The total count of all detected anomalies.
Breakdown of Anomalies: Anomalies are categorized based on a machine learning algorithm threshold or through pre-assigned severity levels. This means that Saner CSPA is almost certain that these anomalies represent legitimate risks:
— Yellow: Low confidence anomalies
— Red: High confidence anomalies
— Orange: Medium confidence anomalies
Each detected anomaly is classified into the following confidence levels:
High Confidence: indicates that most anomalies are significant and require immediate attention.
Medium Confidence: suggests that some anomalies need further validation or investigation.
Low Confidence: refers to minor anomalies, which may involve less critical issues or potential false positives.
What does the “High” Confidence level comprise of?
High confidence level indicates that most anomalies are significant and require immediate attention.
Examples:
— Publicly accessible S3 bucket containing sensitive information
— Misconfigured IAM roles with over-permissive policies exposing critical systems
What does the “Medium” Confidence level comprise of?
Medium confidence level suggests that some anomalies need further validation or investigation.
Examples:
— Unusual but authorized use of privileged accounts
— A resource not encrypted where encryption is recommended but not required
What does the “Low” Confidence level comprise of?
Low confidence level refers to minor anomalies, which may involve less critical issues or potential false positives.
Examples:
— Access from an unusual IP address that aligns with a known employee’s travel
— Temporary policy change flagged as non-compliant but corrected soon after
Any recommendations on resolving anomalies based on severity? How do I prioritize my actions based on the severity?
Minimize risks effectively by addressing High anomalies first, followed by Medium anomalies, and lastly the resolve the low anomalies.
How can I export the anomaly data?
Just go ahead and click the CSV icon available within a view in the Saner CSPA dashboard to export the data into a CSV file for further analysis
What is Posture Anomaly Density and why is it important?
With the Posture Anomaly Density you can quickly identify clusters or areas in your cloud environment with concentrated security posture issues. It provides a high-level overview of concentrated security issues, enabling efficient prioritization and management of resources to improve your overall security posture.
How is the anomaly data visualized on Saner CSPA dashboard?
The data is visualized using a bubble chart with each circle representing a group of anomalies. The size of the circle corresponds to the volume of anomalies within that category. Larger bubbles indicate a higher concentration of security posture issues.
What additional information can I get about the anomaly parameters and how?
Clicking on the bubble navigates you to the Posture Anomaly Parameters that provides detailed information including:
ID: unique identifier of the anomaly
Title: brief description of the anomaly
Number of resources: count of affected resources with the anomaly
How can I use the Posture Anomaly Parameters?
Analyze and prioritize remediation activities using the Anomaly data, Anomaly status(anomalous or normalized) and so on.
What do I interpret from the various sizes of the bubbles?
Clusters of large bubbles indicate areas in your cloud environment with a significant concentration of anomalies. Review and prioritize these areas for investigation and remediation.
What does the Posture Anomaly radar help you with?
The Posture Anomaly radar view allows you to analyze, prioritize, and address misconfigurations or vulnerabilities in different categories, including Management and Governance, Compute, Networking, and more. In the Saner CSPA dashboard, the radar highlights the areas with the most significant posture anomalies, enabling you to concentrate on the categories that need immediate attention.
How can I view detailed anomaly count in the radar?
Hover your mouse over a specific area on the radar chart to view the count of anomalies in that resource category.
What areas are covered in the Posture Anomaly radar?
Common areas include:
— Management & Governance: Issues related to policy enforcement and administrative control
— Compute: Vulnerabilities in virtual machines or containerized environments
— Networking & Content Delivery: Misconfigurations in firewall rules, open ports, or network traffic
— Security, Identity, and Compliance: Issues in permissions, roles, and privileges assigned to users, groups, applications, and services
What are anomaly trends over time?
Anomaly trends over time refer to the monitoring of the number of anomalies related to misconfigurations, policy violations, or security incidents in cloud infrastructure across a defined period. This tracking allows for the evaluation of changes and helps assess the effectiveness of remediation effort.
How does the Saner CSPA dashboard represent anomaly trends?
The dashboard provides a graphical representation of the anomaly count over time, making it easy to visualize patterns, spikes, or reductions in anomalies.
How often is the anomaly trend data updated?
The data displayed on the dashboard is updated after each scan of your cloud environment, making sure that the trends reflect the latest information.
Why are anomaly trends important and how can I use the trend data to improve my security posture on the cloud?
Anomaly trends assist in tracking progress, identifying patterns, and optimizing resources. By analyzing trends, you can identify persistent issues requiring deeper investigation, monitor the effectiveness of implemented security measures, and predict and prepare for potential future risks.
What do sudden spikes in anomalies indicate?
They may indicate misconfigurations introduced by recent changes in the system. It’s essential to investigate the spike immediately to address critical issues and mitigate risks. The “Anomaly Trends over Time” graphical visualization on the dashboard provides a count of anomalies related to misconfigurations, policy violations, or security incidents over a specific period. The data displayed on the dashboard is updated after each scan.
How do I check which anomaly is affecting most of my resources under “Management & Governance” category?
On the Saner CSPA dashboard, navigate to the Posture Anomaly Details view and filter by the requisite category, in this case “Management & Governance”. The corresponding results are retrieved and displayed in the grid view.
How can I utilize the region-wise mapping data to improve my cloud security posture?
Utilize regional insights to prioritize remediation efforts in areas with a higher frequency of anomalies, ensure compliance with region-specific regulatory and data sovereignty requirements, and monitor regions crucial to business operations with increased diligence.
What is Region-Wise Mapping in Saner Cloud Security Posture(CSPA)?
Region-Wise Mapping provides a geographical perspective of the security posture of cloud environments. It displays the distribution of anomalies and resources across different cloud regions on a world map.
Saner CSPA dashboard highlights the total number of regions and anomalies on a world map. Dots on the map represent specific regions, helping to visualize where anomalies or vulnerabilities are located.
How can I check which anomaly is affecting the most resources and the least resources?
The “All Anomalies” feature in Saner CSPA offers a visual representation of both anomalous and normalized data indicators.
The red tiles highlight critical issues that require immediate attention, while the green tiles provide assurance about resource categories that are not problematic.
Anomalous data is displayed in red tiles, with each tile representing a specific category of detected anomaly in the cloud environment. Each red tile includes the following information:
— Anomaly ID (for example, CSPA-AWS-2024-0078)
— A brief description of the anomaly (for example, “frequent CloudTrail console login events”)
— A count displayed on each tile that indicates the frequency or occurrence of that specific anomaly
Green tiles represent normalized data, indicating resource categories that do not have any anomalies.
What constitutes posture anomalies in the cloud environment?
Typically, misconfigurations, policy violations, or deviations from best practices in cloud environments lead to data breaches, downtime, or other risks.
What does the Posture Anomaly visualization in Saner CSPA dashboard display?
The column-based view provides detected anomalies in cloud environments, prioritizing fixes based on confidence levels, affected resources, severity, and compliance with regulatory requirements.
What kind of issues does the Posture Anomaly view convey?
The view highlights issues such as lacking multi-factor authentication (MFA), outdated credentials, service disruptions, vulnerabilities, and region-specific anomalies.
How do I track findings from the Saner CSPA dashboard?
In the Posture Anomaly visualization view within the CSPA dashboard, see the ID column that represents the unique identifier of each anomaly detection rule(for example, CSPA-AWS-2023-004). Use this ID to search and track findings.
What does each column in the Posture anomaly view describe?
Refer to the topic “Understand the Common Elements and Standard Operations” for related details.
What details can users access by clicking the anomaly “ID” or “more” in the “Summary”?
Users can view additional information like a brief summary, anomaly data, status, trends over time, and region-wise mapping.
What actions can users perform in the additional details view?
— Sorting and filtering anomalies
— Viewing the security posture of anomalous and normalized resources”
— Searching using keywords
— Selecting the number of records to display
— Exporting data to a spreadsheet (CSV)
—Toggling the display of whitelisted anomalies
How does regional insights help in addressing anomalies?
Users can focus on geographically critical areas, ensuring anomalies are resolved in regions that may have higher operational or compliance significance.
Why is it important to prioritize fixes based on confidence levels and severity?
Prioritizing ensures that critical issues with a high likelihood of impact are addressed first, minimizing risks to cloud environments.
Can I customize the views to focus on specific type of anomalies?
Yes, users can filter by categories, regions, or other parameters to focus on specific anomalies of interest.
How to Exclude Anomalies in Saner CSPA?
Saner CSPA allows you to assess and exclude specific anomaly IDs from scans. Follow these steps to whitelist anomalies:
Whitelist from the Dashboard:
Step1: Navigate to the CSPA dashboard
Step2: Click the Whitelist link
Step3: Select the anomaly IDs you wish to exclude by checking their corresponding checkboxes
Step4: Click Save to confirm your changes
Whitelist Individual Resources:
Step1: Open the Posture Anomaly Details page
Step2: Click on the individual anomaly ID you want to exclude
Step3: Click Save to confirm your changes
How to view the Whitelisted IDs?
To review your whitelisted IDs:
Step1: Navigate to the Posture Anomaly Details section on the dashboard
Step2: Click the eye icon to view all whitelisted IDs

