In Cloud Infrastructure Entitlement Management (CIEM), critical activities refer to high-risk identity and access operations that significantly impacts cloud security if misused. These activities include privilege escalation (such as attaching Administrator Access), modifying or disabling IAM policies, creating access keys or service tokens, and accessing sensitive services like S3, KMS, or Secrets Manager.
Additionally, they include altering roles, trusting relationships, or grouping memberships, as well as tampering with security controls, such as, deleting audit logs or disabling multi-factor authentication (MFA).
Monitoring and addressing these activities is essential to enforce the principle of least privilege and reduce the attack surface.
What are the Recommended Critical Events to Monitor?
Click here for a detailed list of critical events with description and security implication.
What are the High-Privilege Actions in AWS?
Click here to read more about which actions are considered high-privilege in Critical Activity Logs in AWS and more.
Step 1: Launch Cloud Entitlements
After you login, select Cloud Security from the landing page. Next, click the App Launcher(on top of the page) and choose CIEM(Cloud Infrastructure Entitlement Management).
Step 2: Access the Critical Activities
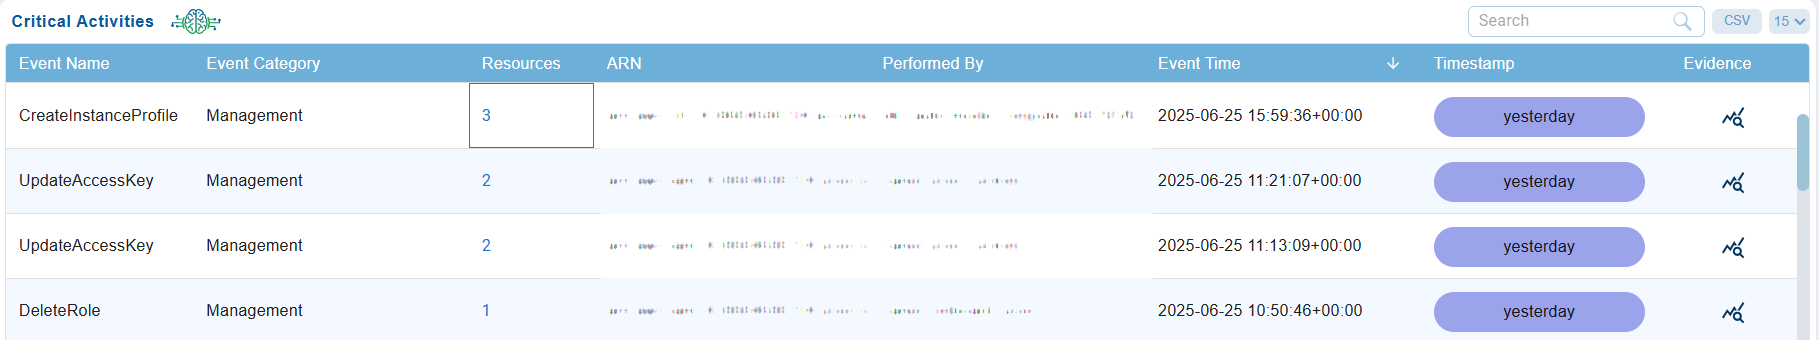
From the CIEM dashboard, access the Critical Activity Logs block.
A quick look at what the columns represent:
| Column | What it conveys? |
|---|---|
| Event Name | Specific action or operation performed(for example, createuser/deleteinstance/updatepolicy). The details provide security teams with a clear understanding of what occured during the logged in event and enables focus on critical operations. |
| Event Category | Categorized the type of event(for example, authentication/access control/data access/configuration) that helps identify and prioritize events based on security relevance. For example, access control change might call for immediate review. |
| Resources | Specific cloud resources affected by the action such as EC2/S3/Database/Virtual Machines. Provides insight into the assets targeted/accessed/modified. Critical for tracking the potential impact of the event in cloud environment |
| ARN | Unique identifier for resources in cloud platform like AWS. Enables precise identification of affected resources involved in an incident. |
| Performed By | Identity(user/role/service) responsible for initiating the event. Identifies who/what triggered the action |
| Event Time | Time stamp of when the event occured. Critical to analyze sequence of events during incidents. |
| Timestamp | The specific time and context of when a high-risk identity or access operation took place. Critical to analyze sequence of events during incidents. |
| Evidence | Verifiable evidence, such as logs, timestamps, activity traces, or event metadata, confirming that a critical identity-related activity occurred in the cloud environment. |
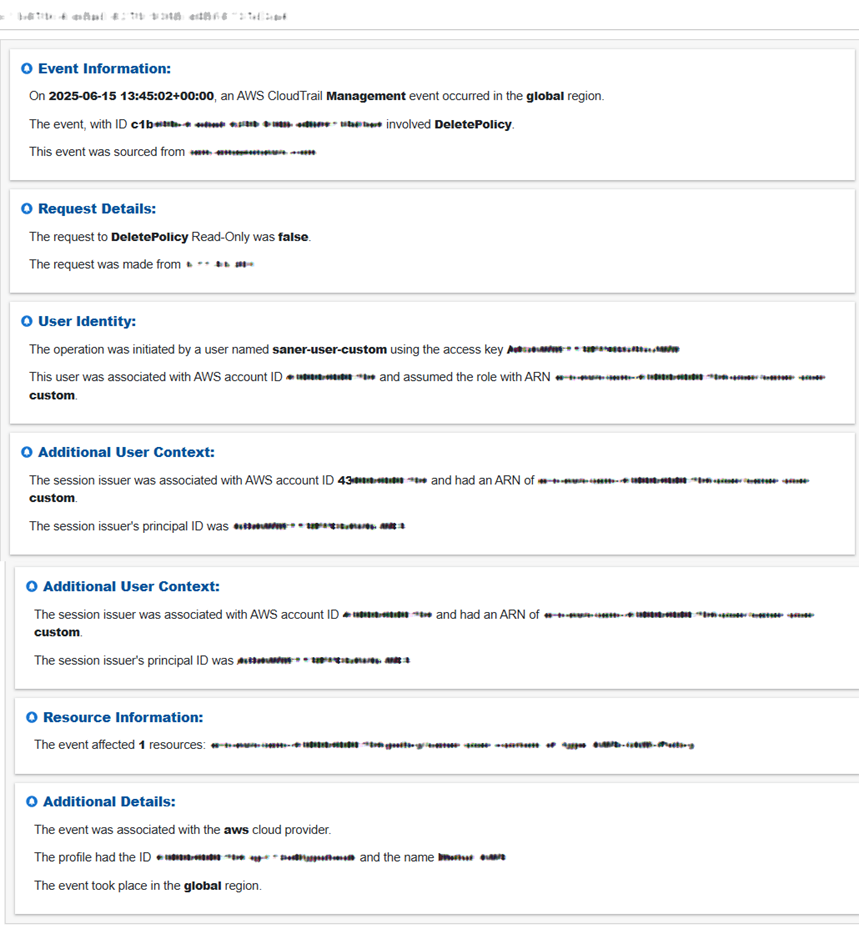
Step 3: What do you see in the evidence?
Click the icon under the Evidence column in the Critical Activities block to view the evidence information.
Step 4: See the Total Count of Resources with Critical Activities
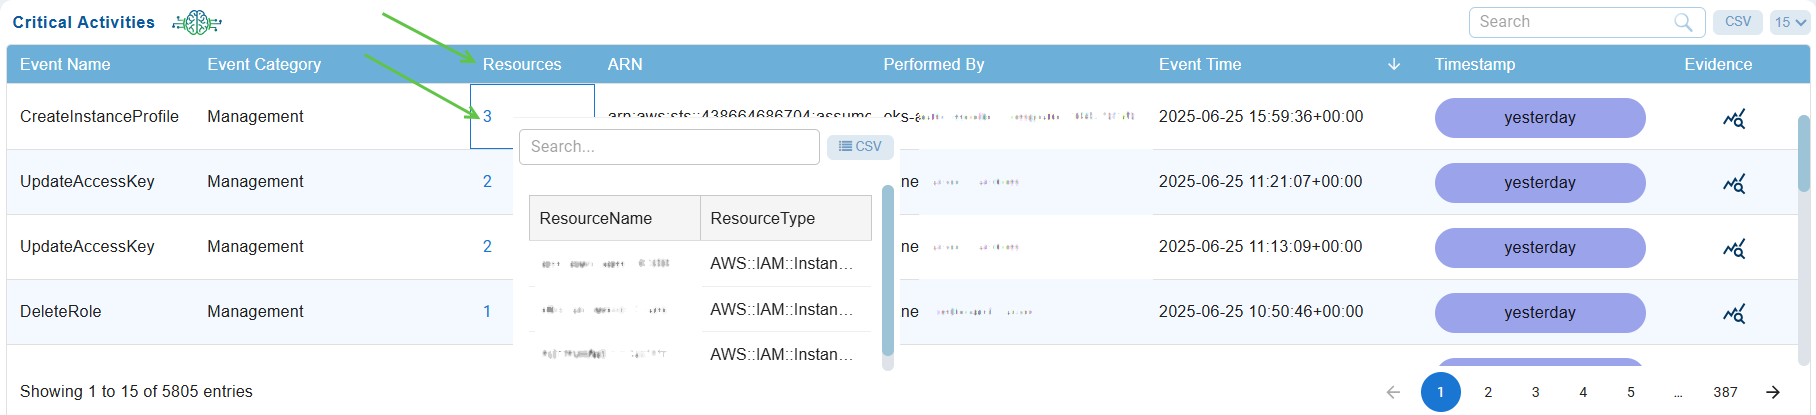
Under the “Resources” column, just go ahead and click on the count to see the resources and types.
Step 5: Filter with Specific Search Criteria for Analysis
Users have an additional capability to filter critical activity logs with specific search criteria. From the search box within the Critical Activities block, key in your search criteria to retrieve the relevant information. Analyze the information for troubleshooting or subsequent action.
See Also

