The Azure Cloud Infrastructure Entitlement Management (CIEM) dashboard provides a unified and data-driven view of identity and permission risks within your Azure environment. It assists security teams in quickly identifying excessive permissions, analyzing high-risk activities, and taking guided remediation actions to enhance the cloud security posture.
Through this dashboard, you can review summaries of excessive permissions across various identity types, including users, groups, applications, and managed identities. You can also dig deeper into RBAC and Entra role assignments that have excessive privileges, gain contextual insights into who has access, how that access was granted, and the potential risk it poses.
To support ongoing risk reduction, the CIEM dashboard features a Recommended Remediation view that highlights identity and resource-related risks, categorized by priority levels. This helps teams efficiently remediate issues based on their severity. You can view detailed identity lists and explore contextual metadata, which enables thorough investigations into how each identity interacts with Azure resources.
In addition to entitlement insights, the dashboard improves operational awareness by allowing you to monitor high-risk events through critical “Sign-In” and “Activity” alerts. For each alert, you can review consolidated evidence, including timestamps, initiators, affected resources, and system-level traces. This information assists in validating incidents and responding appropriately.
Overall, the Azure CIEM dashboard serves as a centralized location for entitlement visibility, risk analysis, and incident investigation, empowering administrators to maintain a least-privilege and secure Azure environment.
Follow the links to learn about the various dashboard functionalities:
Get Started
After you login, choose the organization. Next, select your Saner Cloud Account from the landing page, to which you would have onboarded your cloud provider account.
Next, click the App Launcher(on top of the page) and choose “CIEM Cloud Infrastructure Entitlement Management”.
Review Excessive Permission Summary Across Identity Types
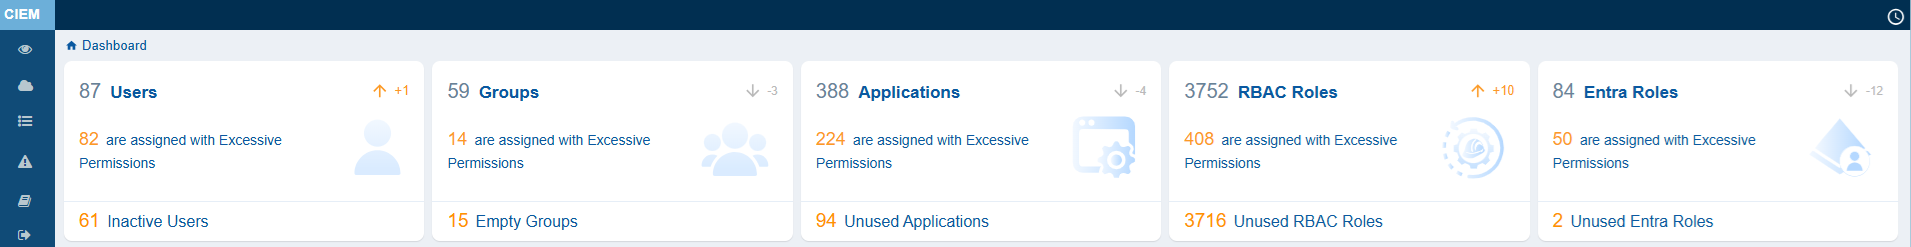
How to Use the Views?
The views allows you to quickly assess access-related risks by highlighting areas that require your attention. Begin by identifying risk hotspots through blocks that display a high number of excessive permissions, for example, Applications or Entra Rol es. Prioritize cleanup efforts by locating inactive, empty, or unused entities that could unnecessarily increase your attack surface. If deeper investigation is needed, expand any block to examine the specific identities or roles involved. Additionally, track trends over time with numeric indicators, that help you monitor any increase or decrease in risk-prone entities. Together, these insights provide a clear starting point for determining where to focus your investigation or remediation efforts.
Users
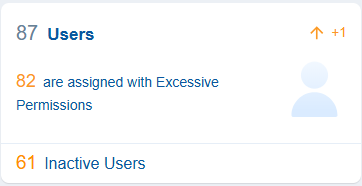
With Saner CIEM, users can identify inactive users in cloud entitlements which refer to accounts or user identities that have access to cloud resources but have not been active, meaning they have not logged in, used, or performed any actions for a considerably long period.
Additionally, the dashboard also presents users with excessive permissions that result in privilege escalation or account compromise issues.
Clicking the the numbers, text, or icon on the block navigates to the detailed contextual view providing a breakdown on the user and their associated permissions.
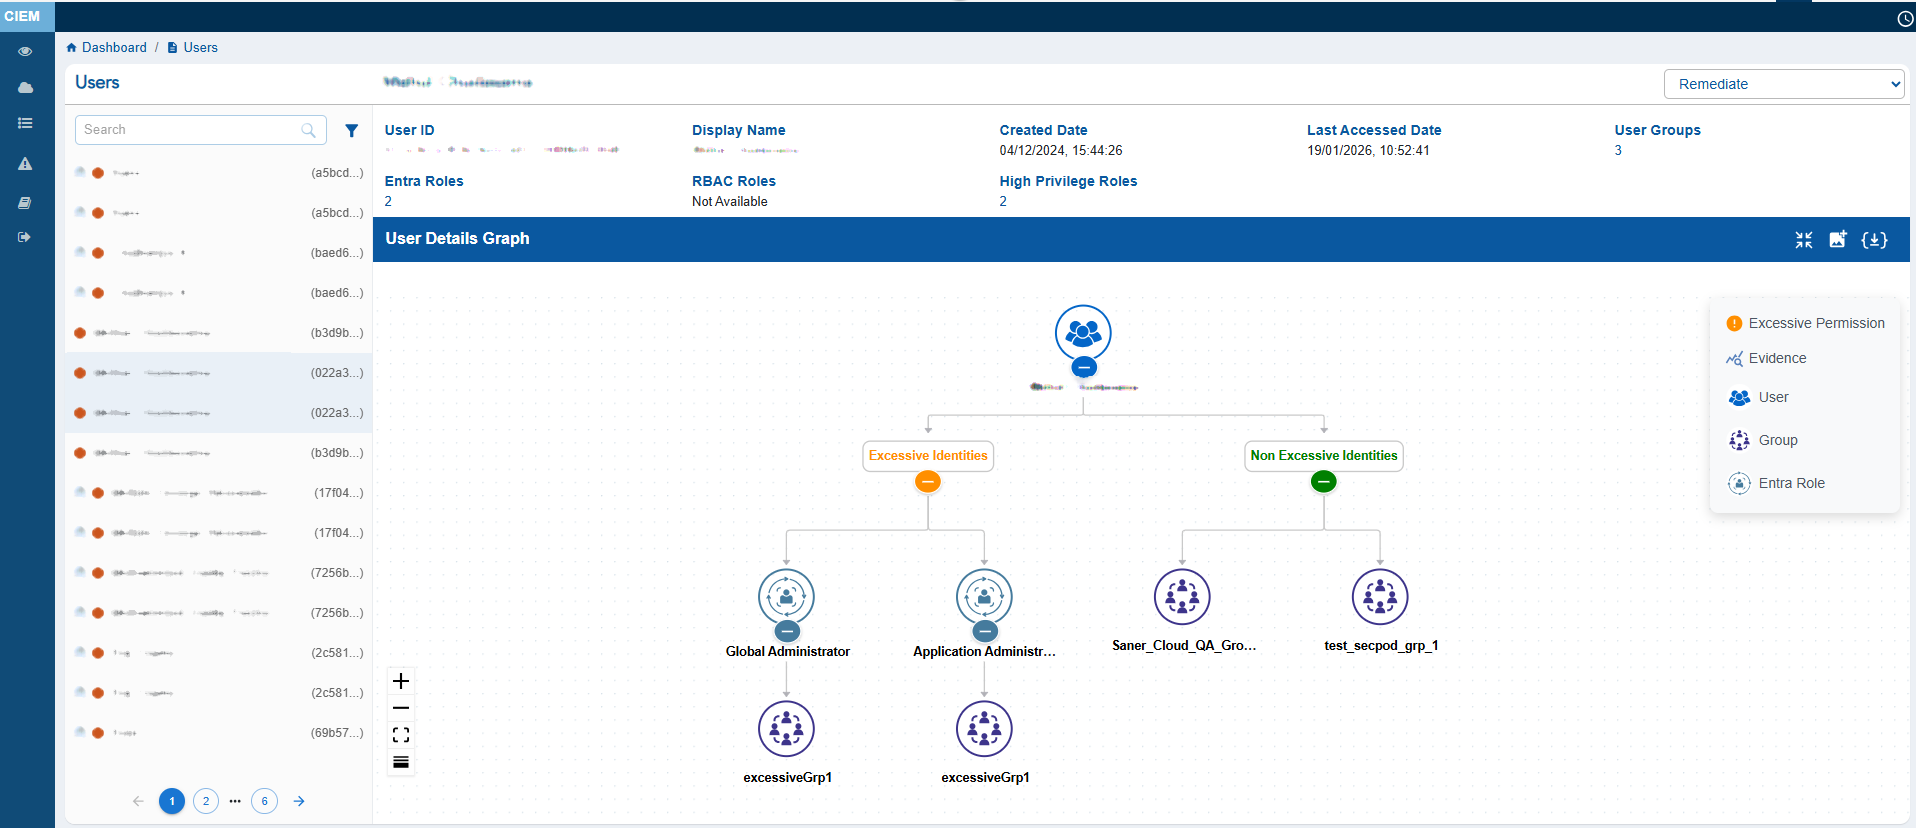
The User Details view provides a consolidated snapshot of an Azure user’s identity attributes and access relationships. It displays key metadata such as the User ID, Display Name, Created Date, Last Accessed Date, associated Entra Roles, RBAC Roles, and User Groups.
The main feature of the page is the User Details Graph, which visually maps the user’s linked Permissions, Actions, Groups and Roles. This helps administrators easily understand hierarchical access paths and inherited permissions at a glance.
The left panel lists all users and includes status icons that indicate their security state: the Hand icon represents Inactive users, the Red icon highlights users with Excessive permissions, and the Green icon identifies Active users. Click the filter button next to the Search box to display the related Unused, Excessive users.
Clicking on the names of Entra of RBAC roles nodes assigned to the user, redirects to the details page of the clicked Role node.
You can either expand or collapse the whole graph with the “Expand All button”, or expand each node separately. The graph can also be viewed in Vertical as well as Horizontal view, just with a click of a button.
Clicking any metadata item that contains a link(for example, Entra ID or User Groups) drills down further into another contextual view showing associated metadata such as user assignments, group details, or linked resources.
Groups
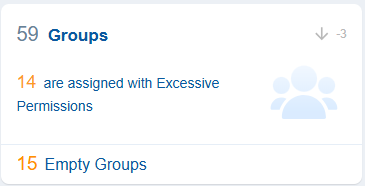
Groups in cloud entitlements refer to collections of user accounts that facilitate management of access rights and permissions in cloud environments.
With Saner CIEM, users can identify Groups which are empty and dormant. The dashboard view also presents the count of groups having excessive permissions in the associated cloud service.
Clicking the numbers, text or icon on the block, navigates to the detailed contextual view providing a breakdown on the group and their associated permissions.
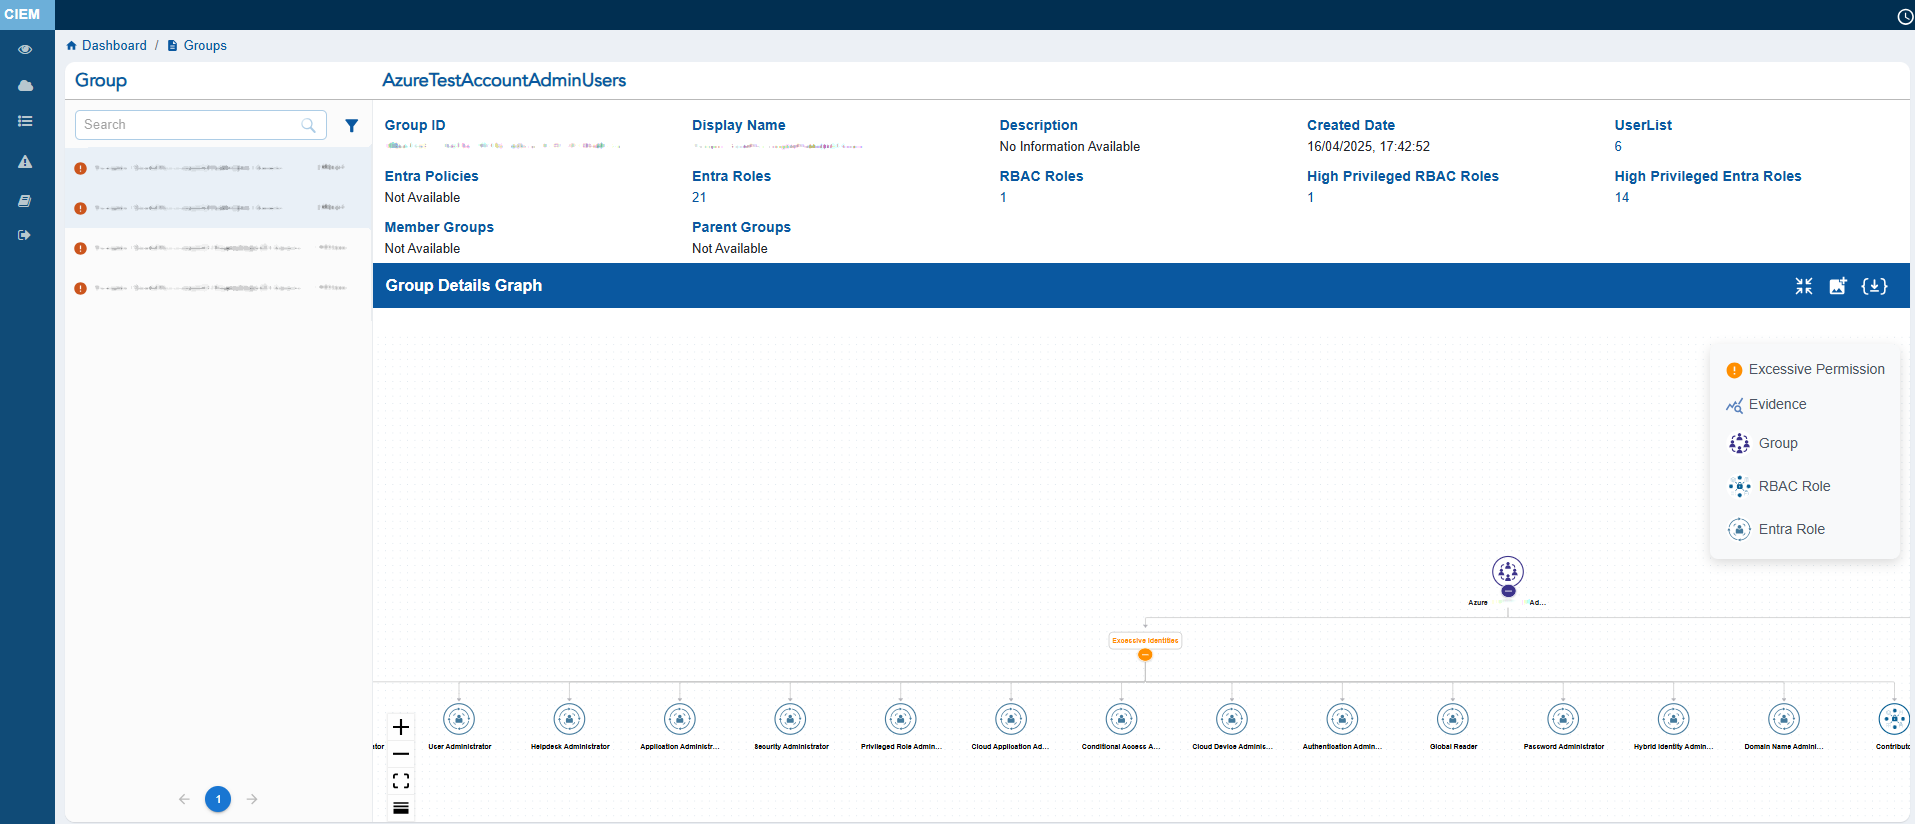
The Group Details view provides a consolidated snapshot of Group’s attributes and access relationships. It displays key metadata such as the Group ID, Display Name, Description, Created Date, associated Entra Policies, Entra Roles, RBAC Roles, and High Privilege Roles.
The main feature of the page is the Group Details Graph, which visually maps the group’s linked users, roles, and policies. This helps administrators easily understand hierarchical access paths and inherited permissions at a glance.
The left panel lists all groups and includes status icons that indicate their security state: the Hand icon represents Inactive groups, the Red icon highlights groups with Excessive permissions, and the Green icon identifies Active groups. Click the filter button next to the Search box to display the related Unused, Excessive groups.
Overall, this view helps security teams assess a group’s access footprint and identify potential risks efficiently.
Clicking any metadata item that contains a link (for example, User List) drills down further into another contextual view showing associated metadata such as user assignments, group details, or linked resources.
Applications
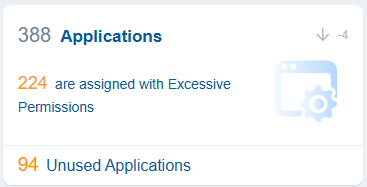
Applications in Azure mean “Azure Entra Applications” (previously called “Azure AD Applications”). These are identity configurations enabling secure authentication and authorization for cloud services, managing access tokens, defining enterprise application permissions, and supporting multi-tenant scenarios with granular security controls for resource access.
Clicking the numbers, text or icon on the block, navigates to the detailed contextual view providing a breakdown on the applications and their associated permissions.
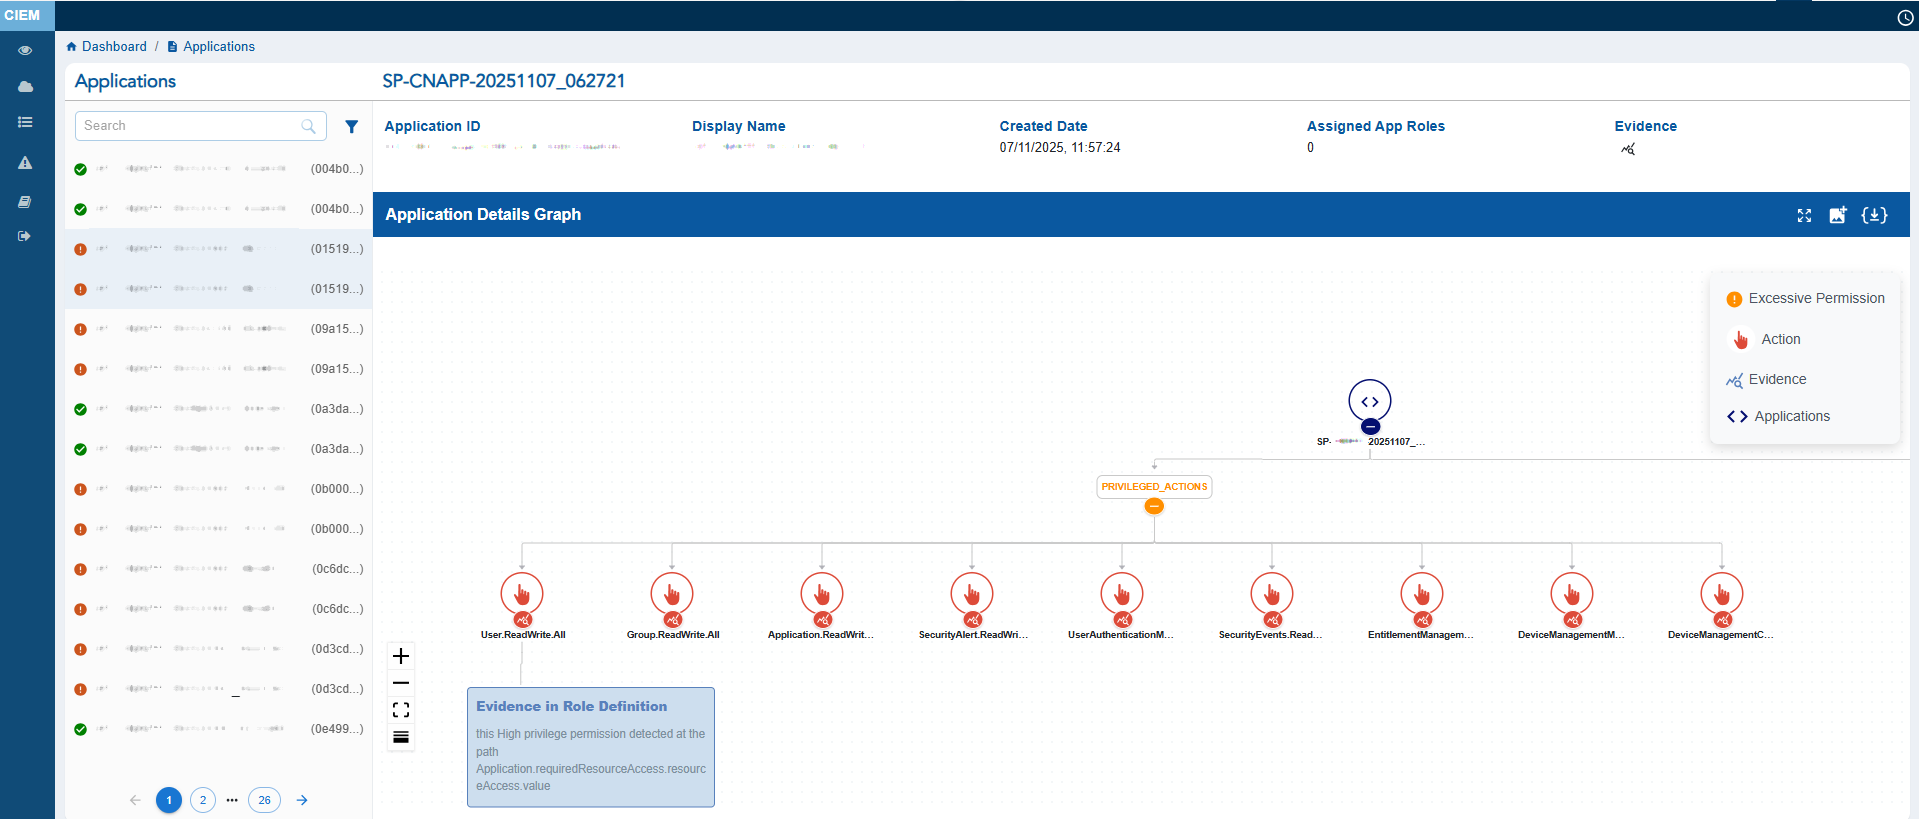
The Application Details view provides a comprehensive snapshot of an Azure application’s identity and permission footprint.
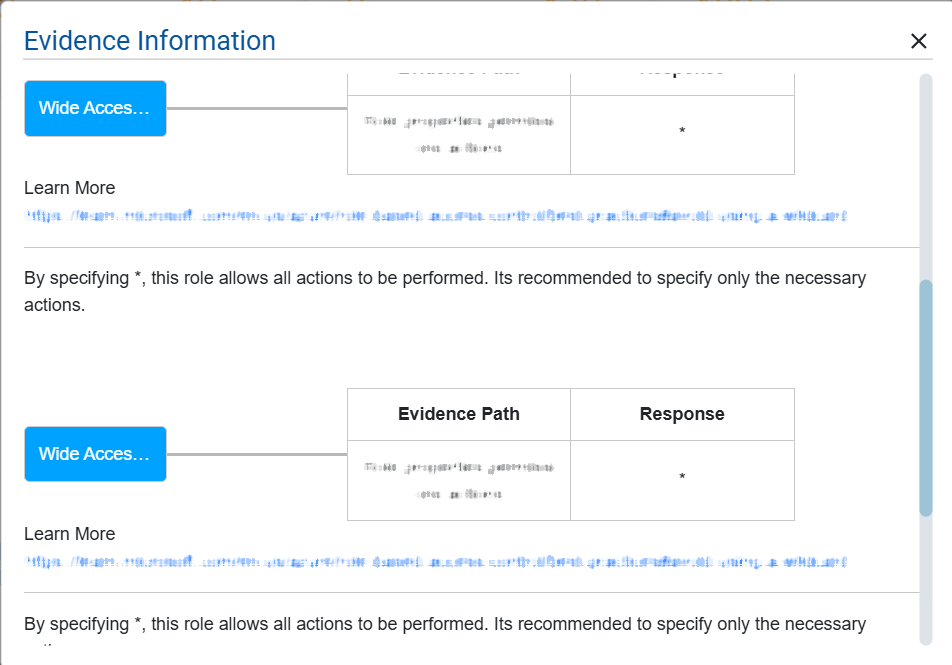
It displays key metadata such as the Application ID, Display Name, Created Date, Assigned App Roles, and available Evidence. Clicking the Evidence icon opens a pop-up from which you can analyze the excessive permission details.
The left panel lists all Applications ID with associated Subscription ID in brackets and includes status icons that indicate their security state: the Red icon highlights Application with Excessive permissions, and the Green icon identifies Application with no Excessive permission.
At the centre, the Application Details Graph visually maps the application’s elevated actions.
User can either choose to expand or collapse the full graph with “Expand All button”, or the can also choose to expand each node separately. The graph can also be viewed in Vertical as well as Horizontal view, just with a click of a button.
The Application Details Graph also helps you understand what makes the Application excessive with Evidence. This information can be accessed by clicking the Evidence node at the end of every excessive action node.
RBAC Roles
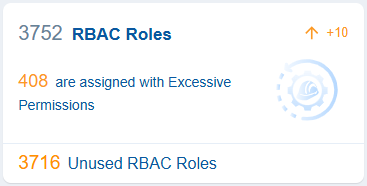
Azure Role-Based Access Control (RBAC) helps manage access to Azure resources by assigning predefined roles that adhere to the principle of least privilege.
In the context of Saner CIEM dashboard, the RBAC view offers a quick overview of roles that may pose security risks due to excessive permissions or unused RBAC Roles that could unnecessarily increase your attack surface.
Clicking the numbers, text, or icon, on the block navigates to the detailed contextual view providing a breakdown on the RBAC Roles and their associated permissions.
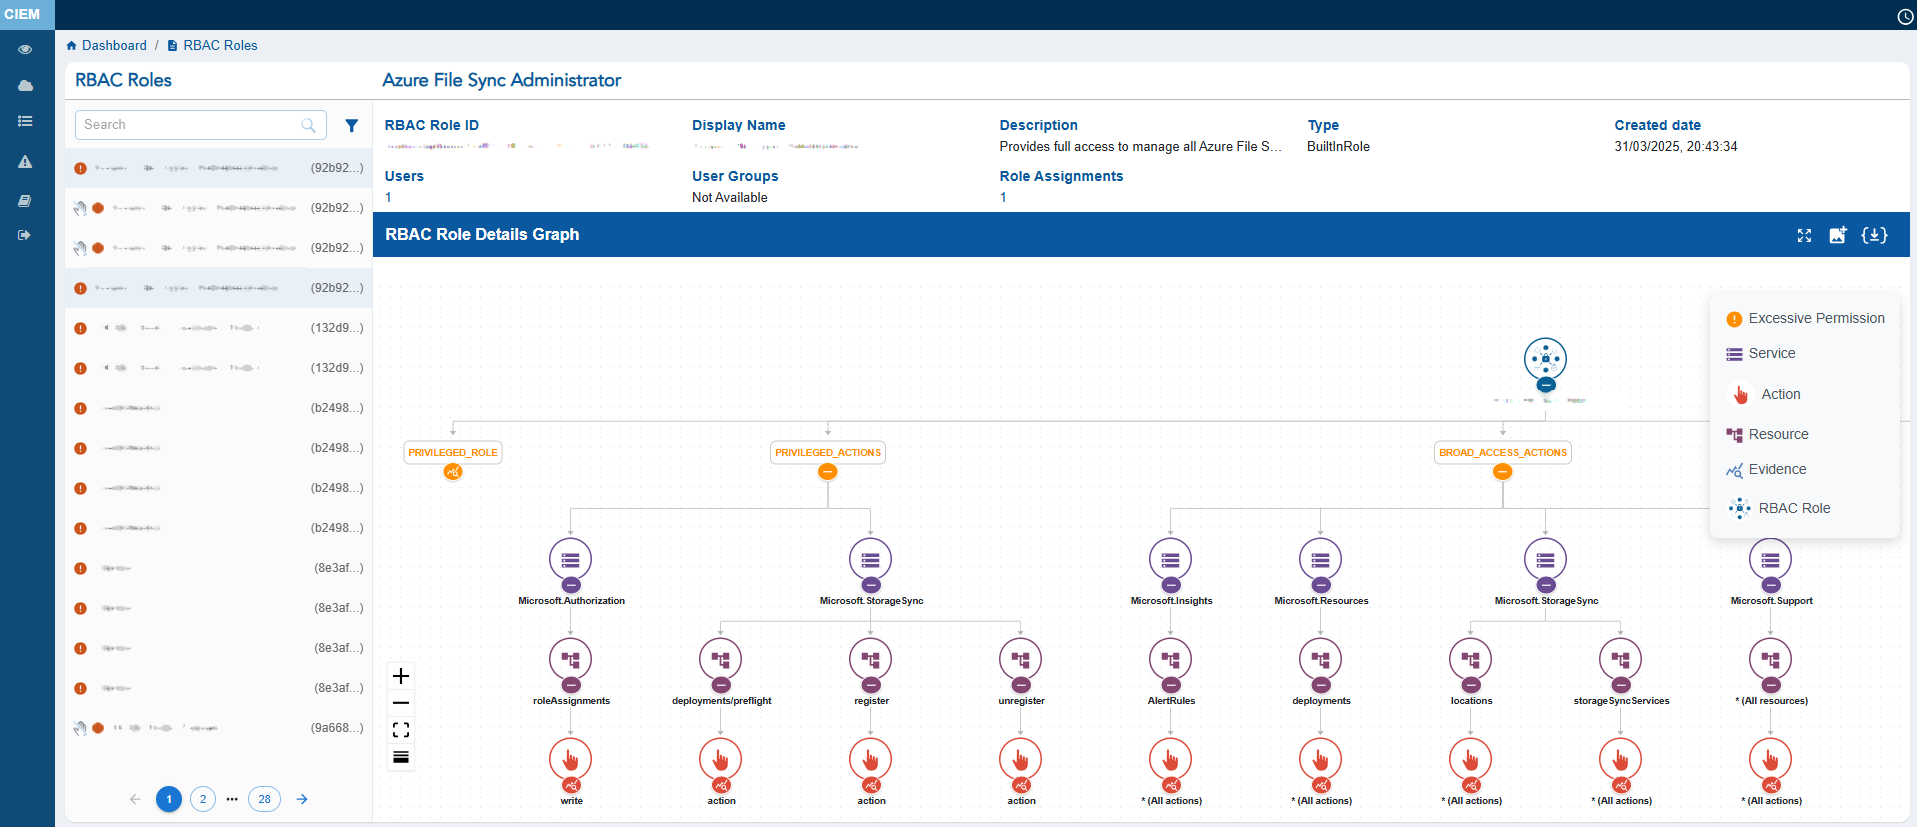
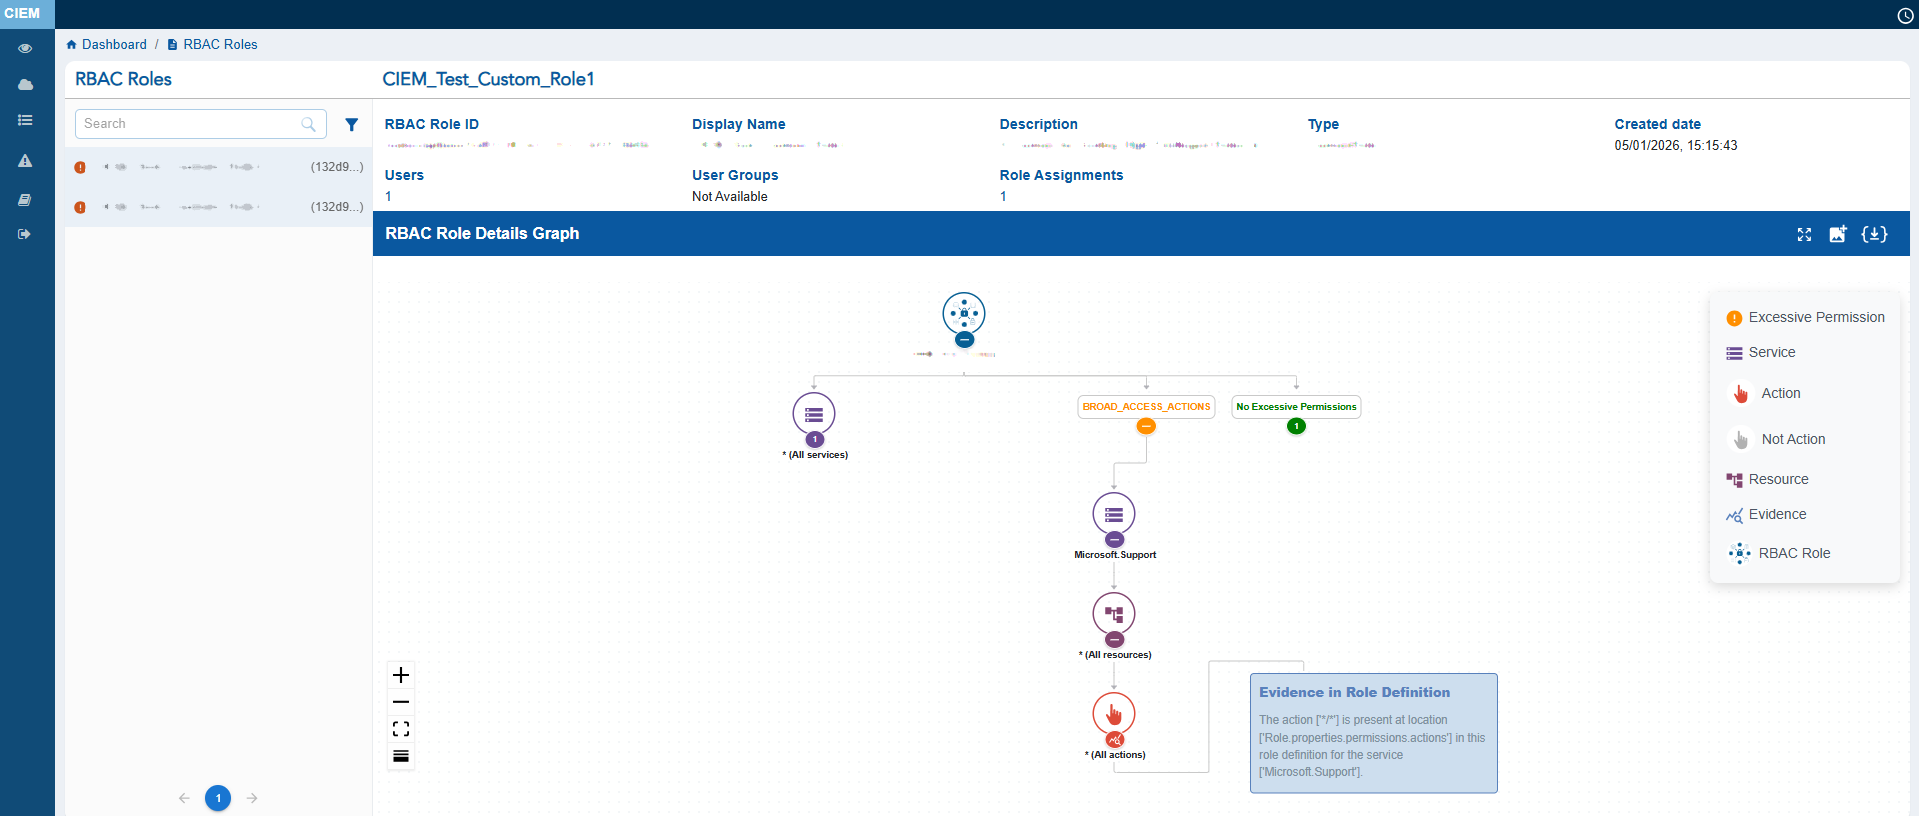
The RBAC Roles displays key metadata such as the RBAC Role ID, Display Name, Description, Type, Created Date, Users, and User Groups.
The left panel lists all RBAC roles and includes status icons that indicate their security state: the Hand icon represents Inactive RBAC Role, the Red icon highlights RBAC Roles with Excessive permissions, and the Green icon identifies Active RBAC roles. Click the filter button next to the Search box to display the related Unused, Excessive applications.
At the centre, the RBAC Role Details Graph visually maps the relationship between the RBAC role and itsassociated services, resources, allowed actions and denied actions, helping administrators understand how permissions flow across identities.
User can either choose to expand or collapse the full graph with “Expand All button”, or the can also choose to expand each node separately. The graph can also be viewed in Vertical as well as Horizontal view, just with a click of a button.
The RBAC Role Details Graph also helps you understand what makes the RBAC Role excessive with Evidence. This information can be accessed by clicking the Evidence node at the end of every excessive action node.
Entra Roles
Azure Entra roles are directory-level roles that specify the administrative actions users, groups, and service principals can take within Microsoft Entra ID. These actions include tasks like user management, application administration, and security configuration.
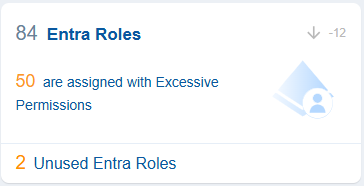
In the context of Saner CIEM dashboard, the Entra Roles block provides a quick assessment of identity-level privilege risks. It highlights roles with excessive permissions, identifies unused or redundant roles, and supports the enforcement of least privilege principles.
Clicking the numbers, text, or icon navigates to the detailed contextual view providing a breakdown on the Entra Roles and their associated permissions.
The Entra Roles Details view provides a comprehensive snapshot of Azure’s directory role configuration and its associated identity assignments.
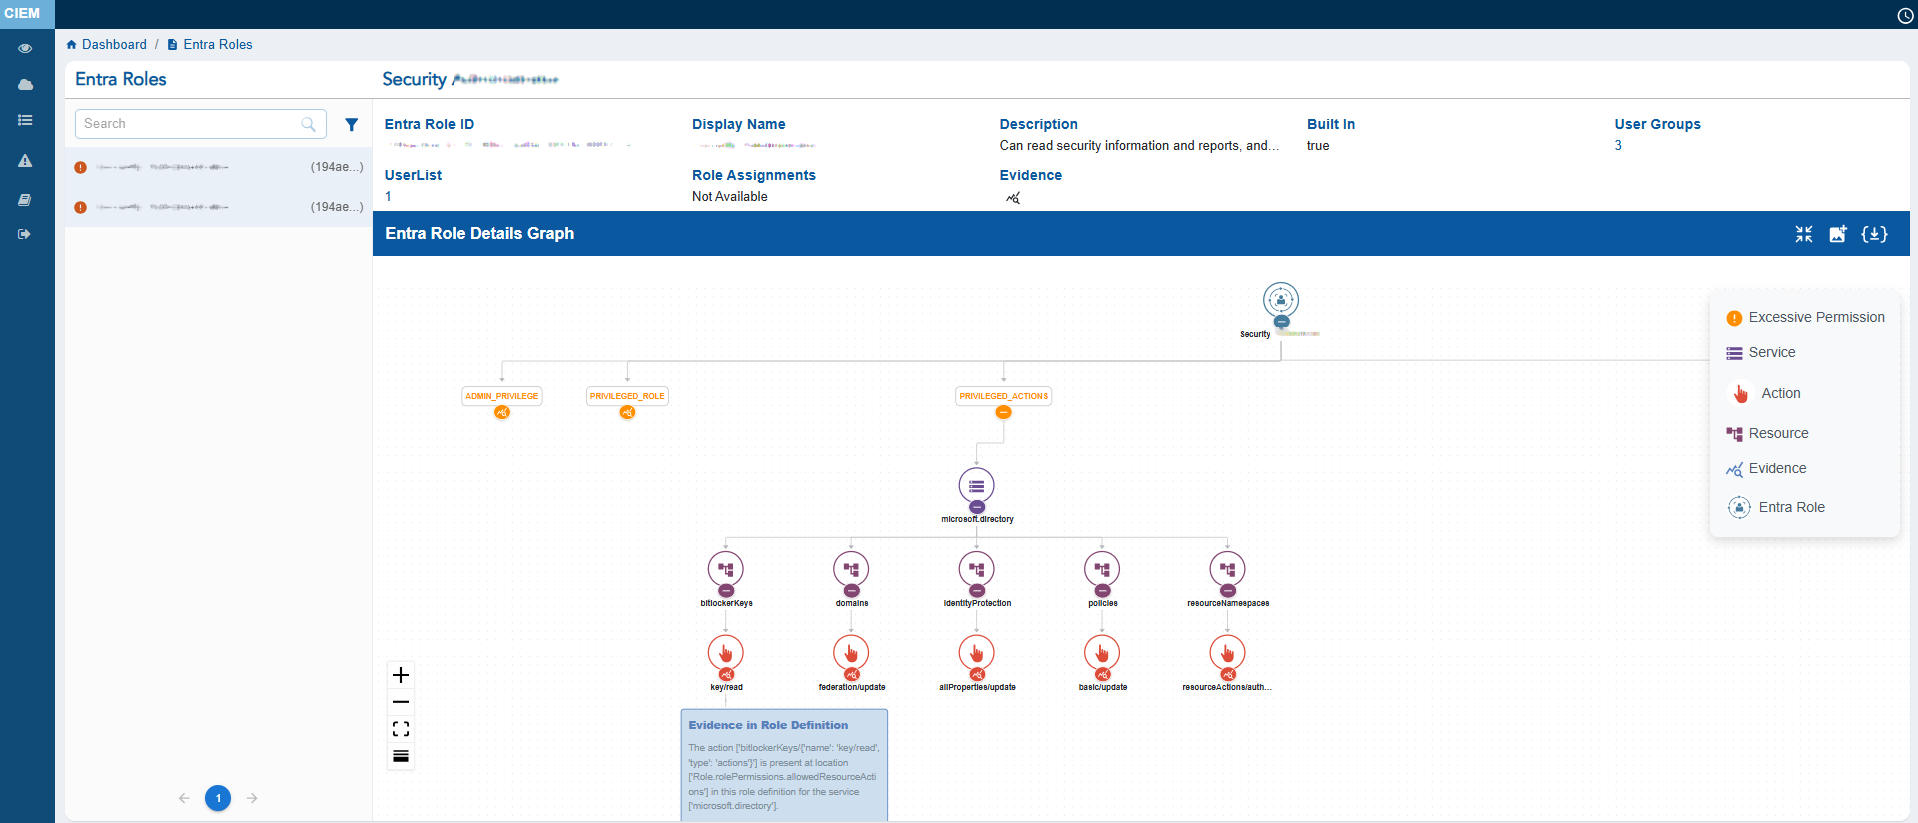
It displays key metadata such as the Entra Role ID, Display Name, Description, Built In, User Groups, UserList, and Evidence.
The left panel lists all entra roles and includes status icons that indicate their security state: the Hand icon represents Inactive groups, the Red icon highlights entra roles with Excessive permissions, and the Green icon identifies Active entra roles. Click the filter button next to the Search box to display the related Unused, Excessive entra roles.
At the centre, the Entra Role Details Graph visually maps the relationship between the Entra role and the associated services, resources, allowed actions and denied actions, helping administrators understand how directory-level permissions are distributed.
User can either choose to expand or collapse the full graph with “Expand All button”, or the can also choose to expand each node separately. The graph can also be viewed in Vertical as well as Horizontal view, just with a click of a button.
The Entra Role Details Graph also helps you understand what makes the RBAC Role excessive with Evidence. This information can be accessed by clicking the Evidence node at the end of every excessive action node.
Monitor Custom and Built-in Role Distribution for Entra and RBAC Roles
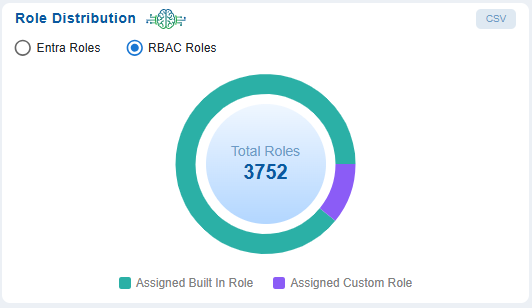
Role Distribution helps administrators quickly understand the balance between built-in(MicrosoftAzure-defined) and custom(organization-tailored) roles across Entra and RBAC contexts which are assigned to an entity. This distribution helps identify if the organization relies heavily on custom roles that could introduce complexity or risk if not properly audited or utilize the built-in rules where possible.
Clicking on a specific category in the pie chart navigates you to a “Details” view and provides a comprehensive breakdown of the role information in the selected category.
Drill-down into Role Distribution for Further Details
The Details page helps administrators understand the structure, assignments, and potential risks of the selected Entra or RBAC role.
Layout Overview:
Left Panel
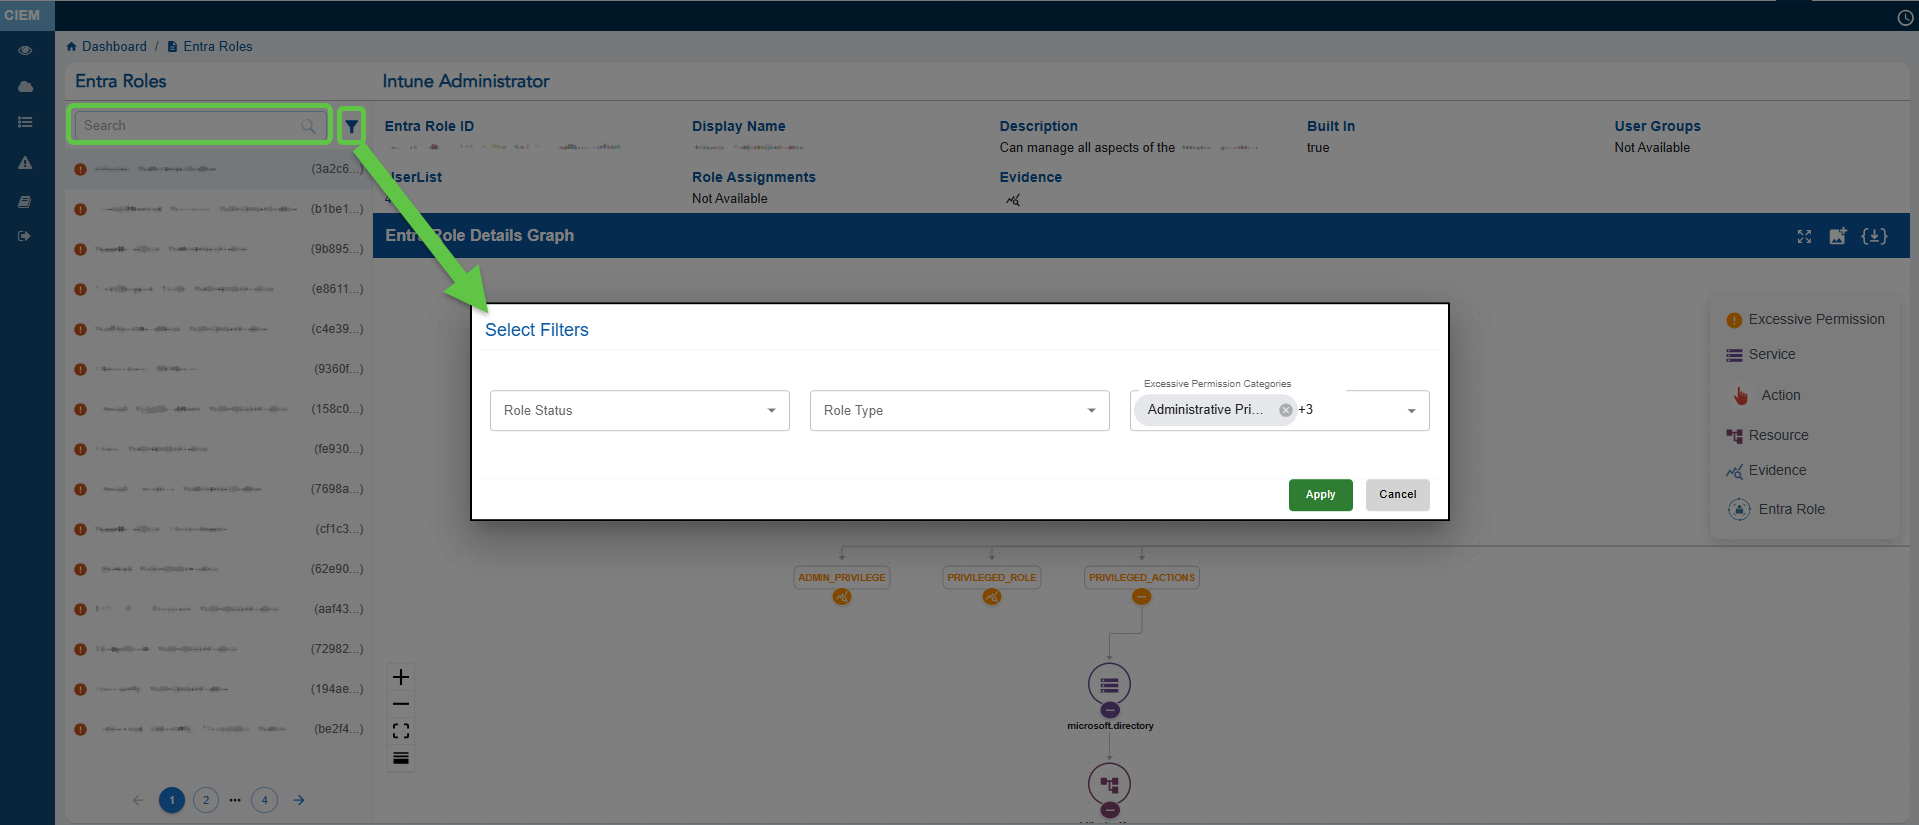
Depending on the role type selected, the applicable list of entra or RBAC roles display in the left panel. You have an option to search by a specific role or apply filters to retrieve specific results. Clicking the filter icon opens a pop-up from which you can determine the role status, role type, and permission category.
Main Panel
The expanded role details page for a selected role(Entra or RBAC) displays key metadata, including the Role ID (unique identifier), Display Name, and Description summarizing the role’s capabilities. It also indicates if the role is Built-in or custom, shows the number of users or groups assigned, and provides an Evidence icon for quick access to correlated risk indicators. Metadata items containing links, such as Role ID or User Groups, allow further drill-down into contextual views that reveal associated details like user assignments, group memberships, or linked resources, enabling deeper analysis of role usage and risk.
Details Graph
The Details Graph(for Entra or RBAC Role) provides a visual mapping of the permissions and resources tied to the selected role. It displays a top-level role node connected to service categories. Icons indicate the level of privilege (read, write, or admin), while toolbar options allow users to zoom, export, or adjust the visualization, making it easier to analyze role structures and access levels in detail.
Analyze Role Assignments Across Azure Scopes
Organizations operating in Azure often struggle with visibility into role assignments across different scope levels such as tenant, subscription, resource group, or resource in RBAC Roles and tenant, administrativeUnits in Entra Roles. Without gaining centralized insight, it becomes difficult to enforce the principle of least privilege and detect excessive access.
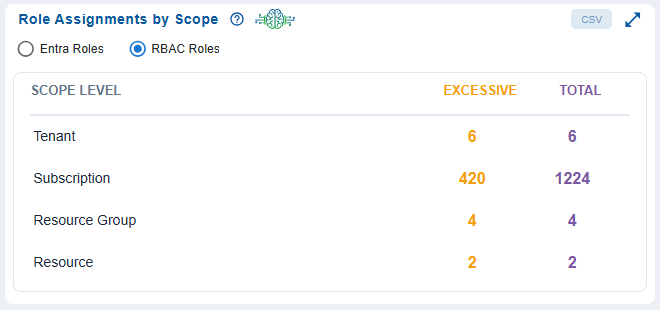
The Role Assignments by Scope dashboard block in Saner CIEM dashboard, directly addresses the challenges by:
- identifying at which level excessive role assignments exist to reduce the attack surface and insider threat potential
- consolidating the view for role distribution allowing for faster remediation
Drill down to Detailed Role Assignment
With drill-down to detailed role assignment pages, the dashboard helps teams to detect, analyze, and remediate excessive access at the right scope level. This reduces risk, improves compliance posture, and strengthens the overall cloud security.
Azure Role Assignment Overview
With drill-down to detailed role assignment pages, the dashboard helps teams to detect, analyze, and remediate excessive access at the right scope level. This reduces risk, improves compliance posture, and strengthens the overall cloud security.
Azure Role Assignment Overview
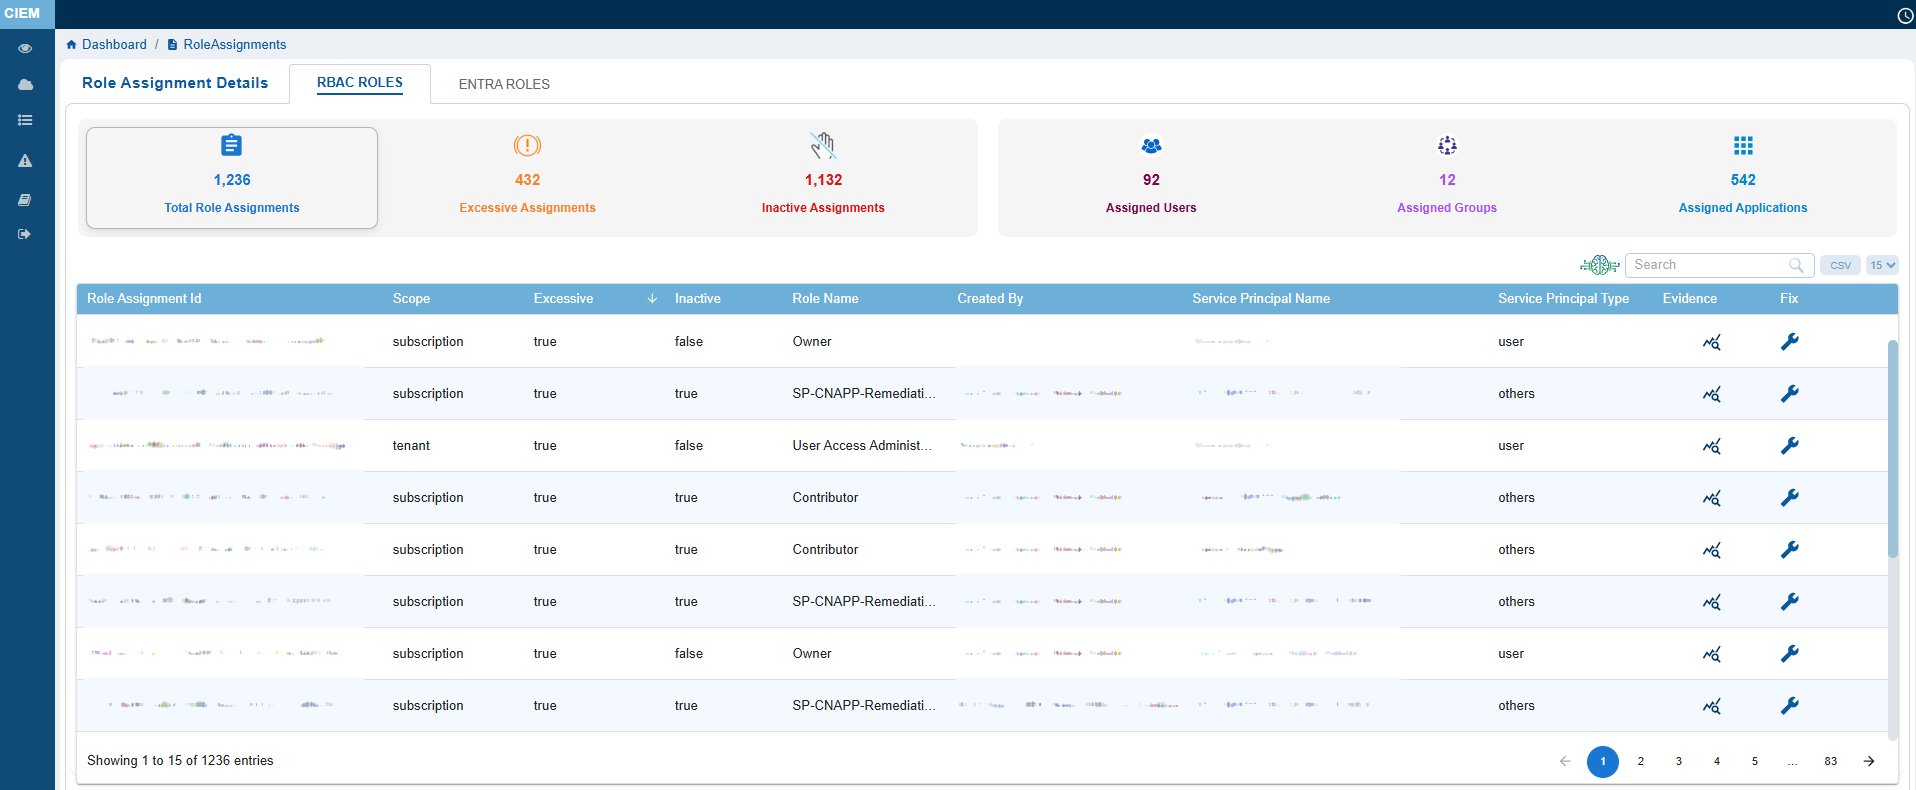
This section reflects Azure’s Role-Based Access Control (RBAC) and Entra Roles models depending on which radio button is selected.
Total Role Assignments
Represents all active role bindings across users, groups, and service principals in the Azure environment.
Excessive Assignments
Indicates roles that grant more permissions than necessary, violating the principle of least privilege.
Inactive Assignments
Roles assigned to identities that haven’t used them recently, suggesting cleanup opportunities.
Users, Groups, Applications
Gives a breakdown of identity types with assigned roles.
Role Assignments Details Table
Role Assignment Id
Unique identifier for the role binding.
Scope
Indicates the level at which the role is applied (for example, tenant, subscription, resource group, or resource in RBAC Roles and tenant, administrativeUnits in Entra Roles).
Excessive
Flags for over-permissioned roles.
Inactive
Flags for dormant roles.
Role Name
Name of the Azure role.
Service Principal Name
Identity that created the assignment or the associated service principal.
Service Principal Type
Type of the service principal identity.
Evidence
Provides supporting data such as role assignment, evidence path, response, related references(links) to learn more details. Clicking the Evidence icon opens a pop-up from which you can analyze these excessive permission details.
Fix
Clicking the icon directs to remediation module(CSRM) for guided remediation of the issue.
Manage and Assess Excessive Permissions by Entra or RBAC Roles
Administrators manage and assess permissions by categorizing them into platform-specific roles(Entra Roles) or a general, standardized access model(RBAC Roles). With the help of Saner CIEM dashboard, this classification helps administrators efficiently manage and assess permissions, also making sure users have appropriate access to resources, reducing the risk of excessive or unauthorized permissions.
You just need to select the relevant permission type option and proceed to view and explore the related contextual details. Just select the relevant permission type option and proceed to view and explore the related contextual details.
View Entra Roles with Excessive Permissions and Explore Contextual Details
The Entra Roles with Excessive Permissions view provides a concise overview of Azure Entra roles that may pose security risks due to their high privilege levels, elevated actions, or broad access policies. From this dashboard view, you can explore specific roles to gain insights into their permissions, assigned users, and relevant contextual information.
Clicking on any count in the block opens a detailed Contextual Information page for the selected role category. This page allows for further exploration through metadata links, allowing you to access deeper layers of related role and permission data.
Step 1: Review Excessive Permission for Entra Roles
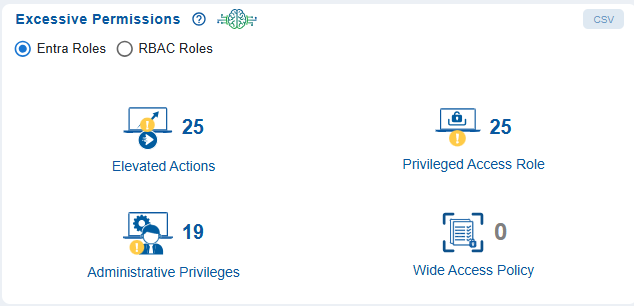
The Entra Roles with Excessive Permissions view helps security administrators to quickly identify potential areas of risk that need deeper investigation.
Administrative Privileges
Shows the number of Entra roles with high-level administrative capabilities.
Elevated Actions
Represents roles that can perform powerful or sensitive operations.
Privileged Access Role
Indicates the number of Azure Entra roles that has higher privileges to access Azure Resources.
Wide Access Policy
Highlights roles granted overly broad or unrestricted access.
Clicking on any count opens a dedicated Contextual Information page, listing all roles related to the selected category.
Step 2: Open Contextual Information for a Role Category
Clicking on any count displayed opens a dedicated Contextual Information page opens, listing all roles related to the selected category.
This view provides metadata such as role ID, display name, description, built-in status, user count, user groups, and evidence indicators.
Step 3: Explore Detailed Entra Role Information

The expanded role details page for a selected Entra role opens and includes Header Metadata that includes
Entra Role ID
Unique identifier for the role
Display Name
Name of the role
Description
Summary of what the role can do
Built-In – Indicates whether the role is a predefined Azure role
User Groups / User List – Number of users or groups assigned
Evidence
Provides quick access to correlated risk indicators
Step 4: Interpret the Entra Role Details Graph with Evidence
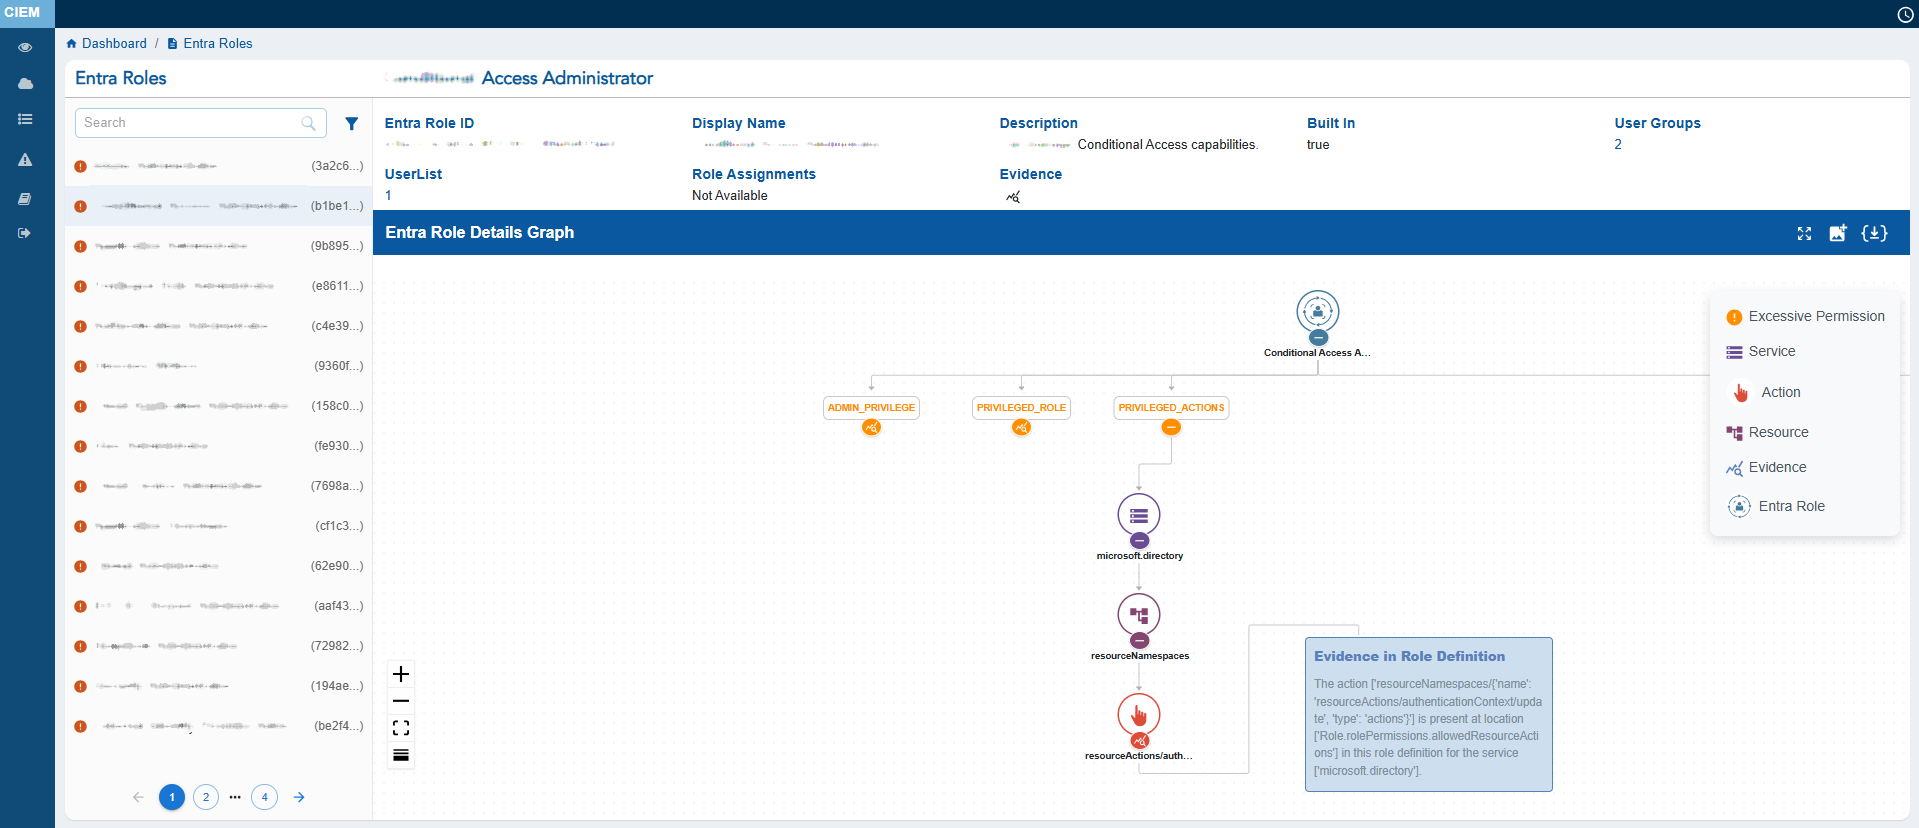
At the centre, the Entra Role Details Graph visually maps the relationship between the Entra role and the associated services, resources, allowed actions and denied actions, helping administrators understand how directory-level permissions are distributed.
User can either choose to expand or collapse the full graph with “Expand All button”, or the can also choose to expand each node separately. The graph can also be viewed in Vertical as well as Horizontal view, just with a click of a button.
View RBAC Roles with Excessive Permissions and Explore Contextual Details
The RBAC Roles with Excessive Permissions view provides a concise overview of Azure RBAC roles that assigns permissions based on roles within an organization, making sure that users only have access to the resources they need to perform their job functions. In RBAC, roles represent a set of permissions, and users are assigned to these roles rather than being assigned permissions directly.
From this dashboard view, you can explore specific roles to gain insights into their permissions, assigned users, and relevant contextual information.
Clicking on any count in the block opens a detailed Contextual Information page for the selected role category. This page allows for further exploration through metadata links, allowing you to access deeper layers of related role and permission data. This helps administrators quickly identify Azure RBAC role assignments that may pose security risks due to elevated, privileged, or overly broad access.
Step 1: Review Excessive Permission Categories for RBAC Roles
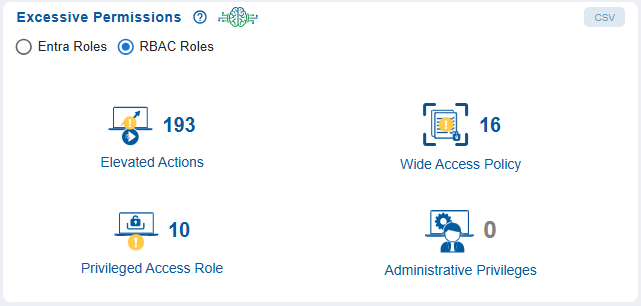
The Entra Roles with Excessive Permissions view helps security administrators to quickly identify potential areas of risk that need deeper investigation.
Wide Access Policy
Highlights roles granted overly broad or unrestricted access (currently none detected).
Administrative Privileges
Shows the number of Entra roles with high-level administrative capabilities.
Privileged Access Role
Indicates the number of roles classified as privileged within Azure Entra.
Elevated Actions
Represents roles that can perform powerful or sensitive operations.
Steps 2, 3, and 4 are similar to Entra Roles. Refer to these steps to know how it applies for RBAC role type.
Identify the Most Privileged Users for Optimization
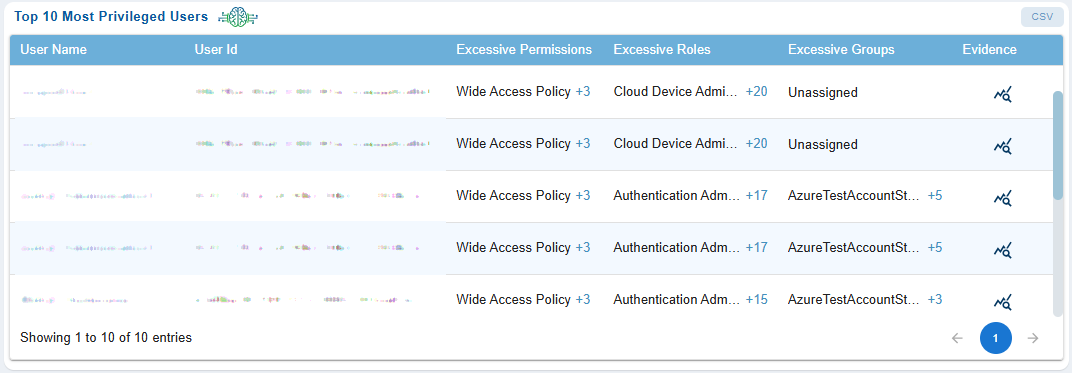
Privileged users are prime targets for attackers and hence its critical to gain visibility into these accounts. This helps security teams to instantly spot high-risk accounts, IT admins to prioritize remediation(remove unused roles/groups), auditors to get clear evidence of who has elevated roles and why, incident response teams to quickly identify risky accounts, and more.
The Most Privileged Users dashboard block in CIEM highlights users, roles, or groups with elevated permissions and that can be optimized for security and compliance reasons.
Here’s a closer look at what each column means:
User ID
Unique identifier for the account (GUID or Object ID in Azure AD).
Username
Display name associated to the user.
Excessive Permissions
Provides the count of permissions beyond normal baseline (for example, global admin, write access to critical resources). Clicking on the count(link) displays the list of elevated permissions assigned to the user.
Excessive Roles
Provides the count of Azure AD roles that exceed job function (for example, Security Admin, Privileged Role Admin). Clicking on the count(link) displays the list of elevated permissions assigned to the role.
Excessive Groups
Provides the count of groups that have exceeding permissions(for example, domain admins, RBAC groups).
Evidence
Unique identifier for the account (GUID or Object ID in Azure AD).
Provides supporting data such as role assignment, evidence path, response, related references(links) to learn more details. Clicking the Evidence icon opens a pop-up from which you can analyze these excessive permission details.
Monitor Top Privileged Role Assignments
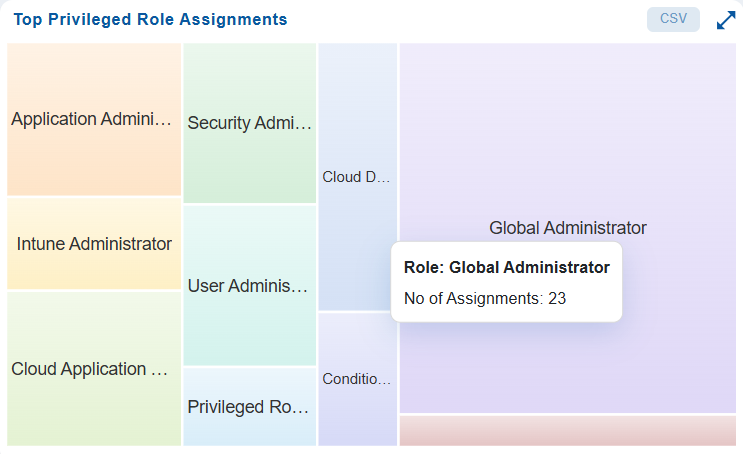
In Saner CIEM dashboard, the Top Privileged Role Assignments block highlights the count of roles that carry elevated permissions and underlying assignments for each role, helping administrators monitor exposure. The heat map provides a quick snapshot into the count of assignments across different roles. Clicking on a specific assignment in the pie chart navigates you to a “Details” view and provides a comprehensive breakdown of the role assignment information in the selected category.
Drill-down into Top Privileged Role Assignments
Azure Role Assignment Overview
This section reflects Azure’s Role-Based Access Control (RBAC) model, which governs who can access what resource.
Total Role Assignments
Represents all active role bindings across users, groups, and service principals in the Azure environment.
Excessive Assignments
Indicates roles that grant more permissions than necessary, violating the principle of least privilege.
Inactive Assignments
Roles assigned to identities that haven’t used them recently, suggesting cleanup opportunities.
Users, Groups, Applications
Gives a breakdown of identity types with assigned roles.
Role Assignments Details Table
Role Assignment Id
Unique identifier for the role binding.
Scope
Indicates the level at which the role is applied (for example, tenant, subscription, resource group).
Excessive / Unused
Flags for over-permissioned or dormant roles.
Role Type
Specifies if it’s a built-in or custom role.
Role Name
Name of the Azure role.
Created By / Service Principal Name
Identity that created the assignment or the associated service principal.
Evidence
Provides supporting data such as role assignment, evidence path, response, related references(links) to learn more details. Clicking the Evidence icon opens a pop-up from which you can analyze these excessive permission details.
Fix
Clicking the icon directs to remediation actions.
Remediate Identity and Resource Related Risks Through Recommended Remediation
The Recommended Remediation view in the Azure Cloud CIEM(Cloud Infrastructure Entitlement Management) dashboard provides security teams with a centralized way to identify and address identity and resource risks. It highlights issues such as inactive Entra ID users, dormant groups, overly permissive RBAC roles, misconfigured directory roles, and unused service principal applications, offering a prioritized list of remediation actions.
These insights help administrators to effectively reduce Azure’s attack surface by:
– Revoking unnecessary Entra ID or Azure RBAC permissions
– Removing inactive or outdated role assignments and role definitions
– Correcting high-risk or misconfigured RBAC and directory-level permissions
– Making sure that resource access adheres to least-privilege principles
From this view, administrators can directly initiate remediation steps, which automatically redirect to CSRM (Cloud Security Resource Management) for tasks such as patching, privilege correction, or role modification workflows. This streamlines identity governance and enforces secure access across Azure environments.
Step 1: Navigate to Recommended Remediation
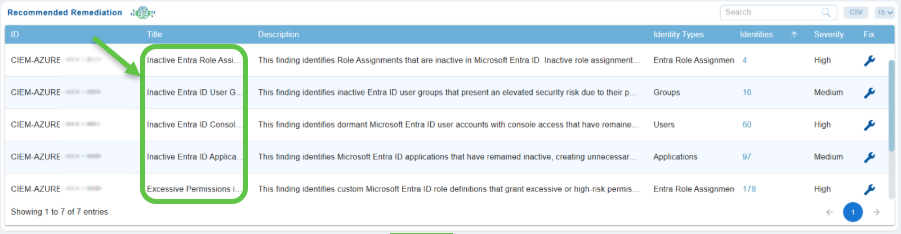
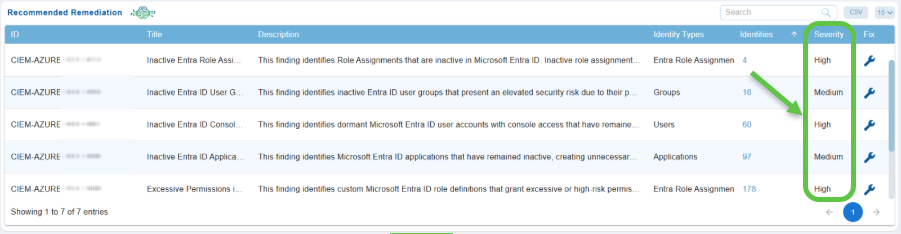
Open the Saner Cloud CIEM dashboard and go straight down to the “Recommended Remediation” view. Your page displays entries such as inactive Entra ID users or dormant Entra ID groups, similar to the items shown in the screenshot.
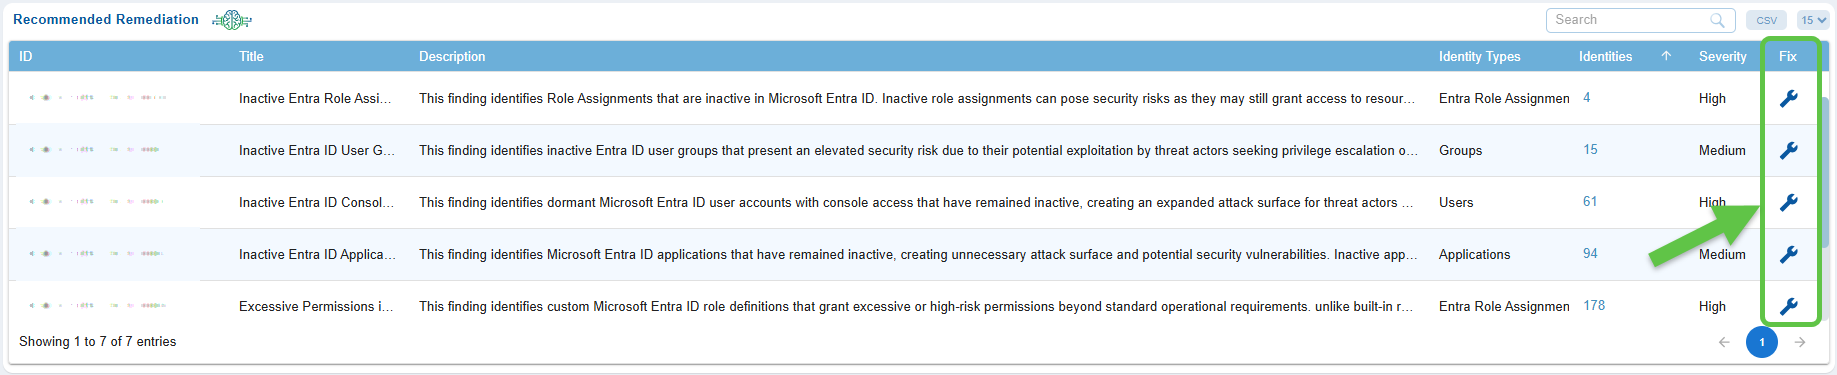
Step 2: Review the Remediation Findings
Every finding includes the following details for which you understand the impact and priority.
- ID – Unique Identifier for the finding
- Title – Descriptive heading for the finding, for example, Inactive Entra ID User Group
- Description – explains why this identity is a risk
- Identity Type – Indicates if the identity belongs to Users, Groups, Roles(RBAC, ENTRA), Application
- Identities – Indicates the count across each type
- Severity – Severity rules are configure to display only “High” severity findings
- Fix – clickable button to proceed with remediation
Step3: Select an Identity Type to Remediate
The system allows remediation for:
- Azure Entra ID Users
- Azure Entra ID Groups
- Azure Entra Roles
- Azure RBAC Roles and Assignments
For example:
Dormant Entra ID user group → Remove group or reduce its assigned roles
Inactive Entra user → Disable or delete account
Overly permissive RBAC assignment → Reduce permissions or remove role
Step4: Open the Remediation Panel
Click the Fix icon (wrench symbol). The panel opens allowing you to:
- View the affected Azure identities
- Validate impact before remediation
- Select identities for bulk removal or modification
Step 5: Trigger the Remediation Task
Once you have selected the identities, click Proceed. The system automatically redirects you to CSRM, where:
- A remediation task is created
- Permissions/roles/groups are modified
- Inactive identities are deactivated or removed
Step 6: Complete the Patching
Finalize the remediation by confirming the changes. The update is then reflected back in the CSRM dashboard.
Prioritize Remediation with Severity
Any misconfigurations identified, are flagged and assigned severity status to help prioritize them.
View Identity Lists and Explore Contextual Information
The Recommended Remediation view allows you to explore the identities or resources linked to each finding. This feature allows you to quickly identify the users, groups, applications, or roles that are affected. You can also review their detailed metadata, permissions, and the relationship graph. This information aids security teams in validating risks, understanding access paths, and making informed decisions about remediation.
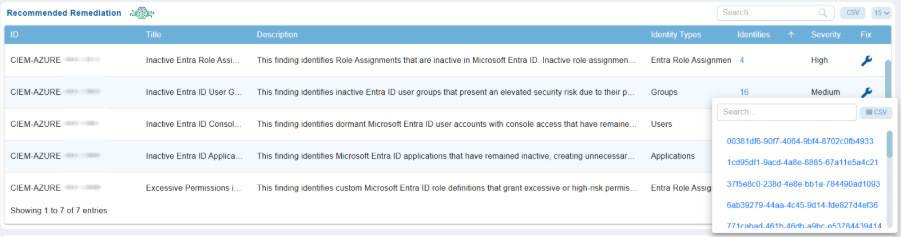
Step 2: Select an Identity
In the pop-up window, browse the list of identities and click on any identity name to open its Additional Details page.
Step3: Review the Contextual Information from Additional Details Page
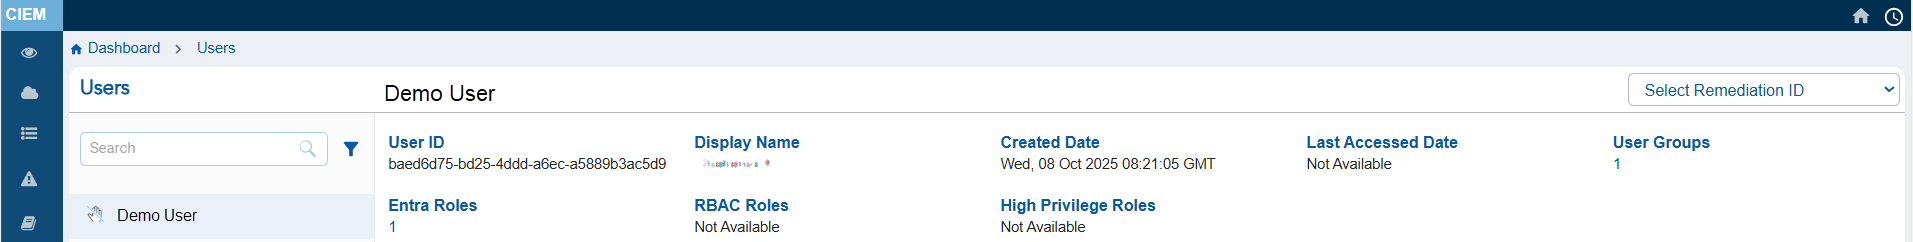
At the top of this page, review the metadata header that helps you understand the identity’s activity status, creation history, role configuration, and so on. Note that the metadata header varies per the identity selected.
Step4: Analyze the Details Graph
Use the visual map to understand how the identity interacts with Azure resources and locate any over-privileged or unused access relationships.
Step5: Filter by Unused or Excessive Permissions
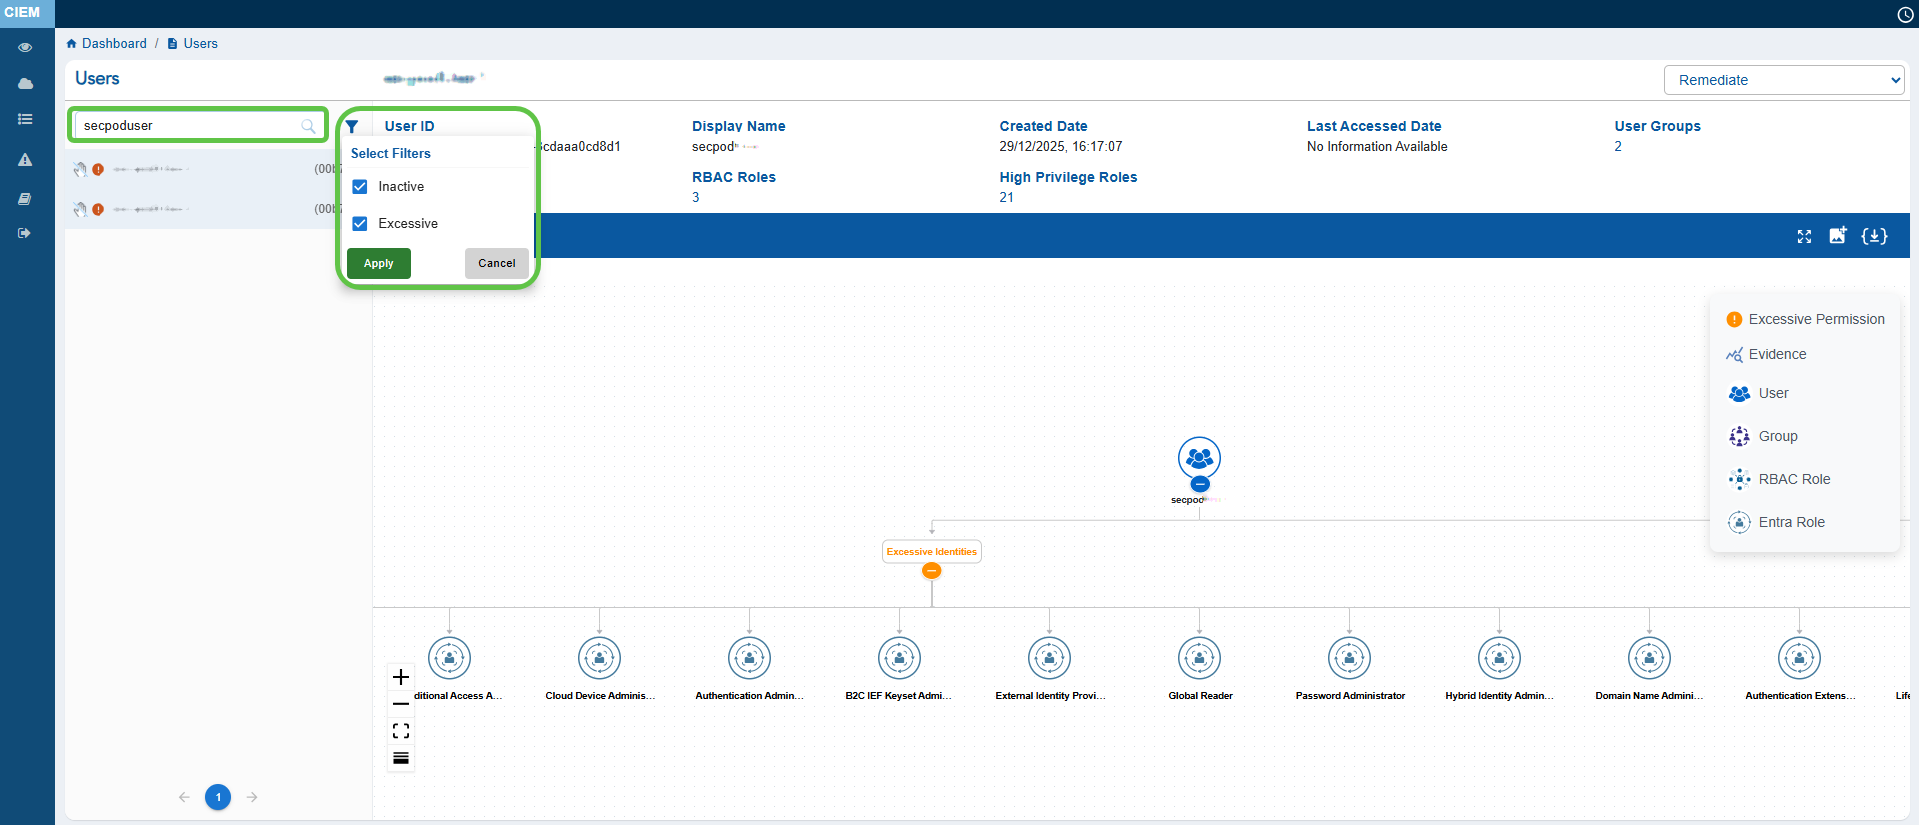
From the left-hand-side pane, click the filter button next to the Search box to display the related Unused, Excessive identities or resources.
Monitor High Risk Events Through Critical Activity “Sign-In” and “Activity” Alerts
Critical Activities refer to high-impact and high-risk actions performed by users, service principals, workloads, or automated processes. Examples of critical activities include abnormal or risky sign-ins, failed authentication attempts, role assignments, privilege escalations, deletion or modification of sensitive resources, identity configuration changes, and access policy updates.
Saner CIEM(Cloud Infrastructure Entitlement Management) helps monitor High-Risk Events through Critical Activity “Sign-In” and “Activity” Alerts dashboard views. These views provide continuous visibility into sensitive authentication attempts and high-impact operational actions across the cloud environment. The detailed evidence views present initiator information, location data, impacted resources, and event outcomes, that help analysts efficiently investigate alerts, validate legitimacy, and take corrective actions.
Saner Cloud uses the Azure API to retrieve sign-in events and audit logs from the cloud service provider, displaying them on the CIEM Dashboard as “Sign-In Alerts” and “Activity Alerts” respectively.
Which Risk Detection Type causes Azure to Consider a Sign-in Event as Risky?
Azure considers an event to be risky based on the Risk Detection Types described in the following table:
| Risk Detection Type | Description |
|---|---|
| Anonymous IP address (or “activity from anonymous IP address”) | Sign-in originated from an IP address identified as anonymous — e.g. a public VPN, Tor exit node, or “anonymizer” IP. (Microsoft Learn) |
| Unfamiliar sign-in properties | The sign-in used properties (IP address, ASN, location, device, browser, tenant-subnet, etc.) that are not seen in the user’s historical login patterns. (Microsoft Learn) |
| Atypical travel / Impossible travel | Sign-ins from geographically distant or unexpected locations (for that user), in a way that indicates it’s unlikely to be a legitimate travel — e.g. two sign-ins close in time from distant countries. (Microsoft Learn) |
| Malicious / malware-linked IP addresses / suspicious IPs / threat-intelligence flagged IPs | Sign-in from IP addresses known to be associated with malware, threat actors, or flagged previously for malicious/abusive activity. (Argon Systems) |
| Leaked credentials / compromised credentials | Sign-in when credentials for the user are known to be leaked (e.g. via dark-web/dumps), or reused/stolen credentials detected. (TechDocWeb.com) |
| Anomalous token usage (token replay / unusual token properties) | Use of a token (session token / refresh token) in a context that doesn’t match the user’s typical behavior — e.g. unusual location, application, user-agent, or token Risk detection type Description lifetime — indicating possible token theft or replay. (Microsoft Learn) |
How to Manage these Actions? Any Recommended Best Practices?
Audit These Actions Regularly
Ensure these actions are logged in AWS CloudTrail and reviewed periodically.
Restrict Permissions
Use the principle of least privilege, granting access to these actions only to trusted, high-level users or service roles.
Enable Multi-Factor Authentication (MFA)
Require MFA for users with permissions to perform these actions.
Use Resource Policies
Set resource-based policies to add an extra layer of control.
Tag Governance
Maintain a tagging strategy and monitor untagging actions.
Interpret the Columns in the Critical Activities “SIGN IN Alerts” View
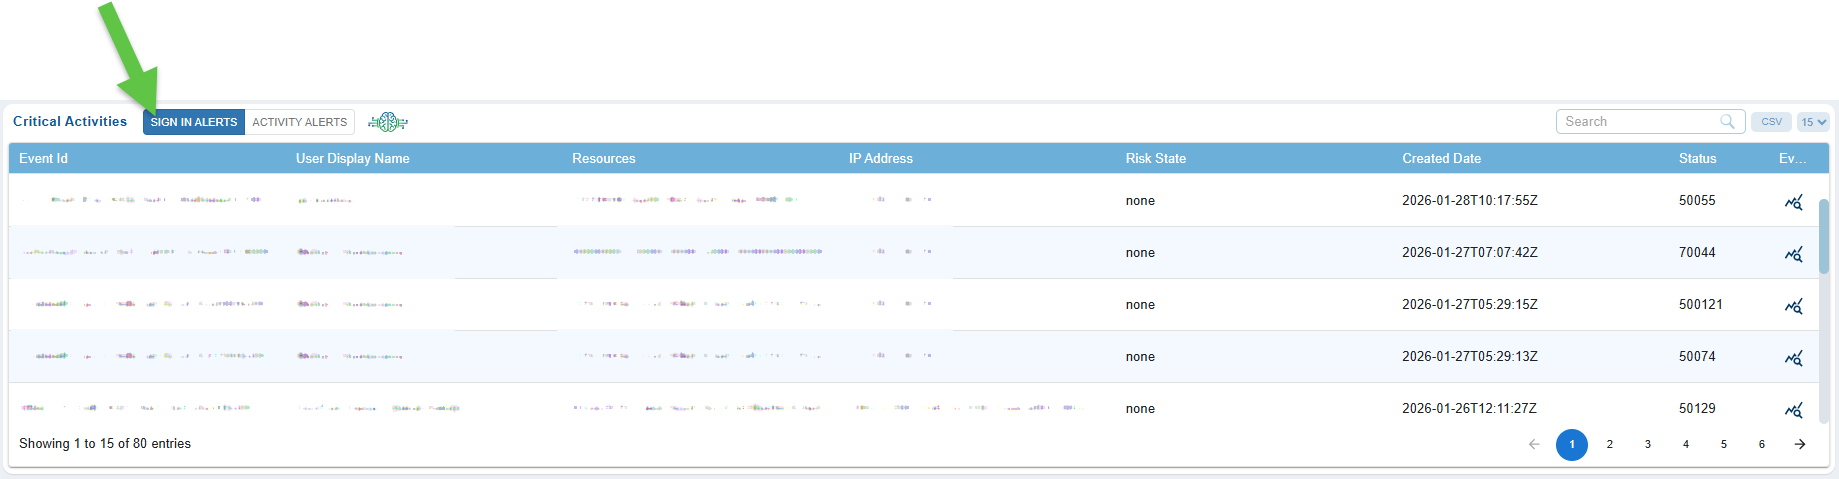
Note that Saner Cloud only displays Sign In alerts that are flagged as “Risky” by Azure to keep you focused on the important events.
Saner Cloud uses Azure API to fetch the Sign In events and display them on CIEM Dashboard as SIGN IN ALERTS.
The SIGN IN Alerts view provides a detailed breakdown of authentication-related activities, helping security teams analyze who attempted to access cloud resources, from where, and with what level of risk.
Each column provides specific insight, from identifying the event through its unique Event ID, to understanding user context, accessed resources, originating IP address, evaluated risk level, timestamps, system status codes, and the supporting evidence behind each alert, allowing effective monitoring, investigation, and response to potential identity-based threats.
| Column | Description |
|---|---|
| Event ID | A unique identifier automatically assigned to each sign-in alert. It helps trace, reference, and investigate a specific authentication event. |
| User Display Name | Shows the name of the user account involved in the sign-in activity. This helps identify who attempted or completed the login. |
| Resources | Indicates the resource, application, or cloud asset that the user attempted to access during the sign-in. It helps correlate authentication with access intent. |
| IP Address | Displays the public IP address from which the sign-in attempt originated, allowing for geolocation checks, suspicious network detection, and anomaly investigation. |
| Risk State | Represents the evaluated risk level of the sign-in event (for example: none, low, medium, high). This helps prioritize alerts based on potential threat impact. |
| Created Date | Shows the exact timestamp of when the sign-in event occurred, helping in timeline reconstruction and forensic analysis. |
| Status | Provides the system status or event code associated with the sign-in alert (e.g., success, failure, or specific authentication response codes). |
| Evidence | The Evidence panel for Critical Activity Sign-In Alerts provides a snapshot of all the details related to an authentication event. This includes the event’s timestamp, unique IDs, and alert type. Key request information is highlighted, such as the client application used, the user’s IP address, and device characteristics like browser version and operating system. Additionally, the panel displays the sign-in location, providing information on the city, state, country, and geographic coordinates derived from the IP address. Finally, it summarizes the authentication outcome, indicating if the attempt was successful or failed, along with any associated error codes and specific reasons for failure, such as policy blocks or multi-factor authentication (MFA) requirements. |
Interpret the Columns in the Critical Activities “Activity Alerts” View
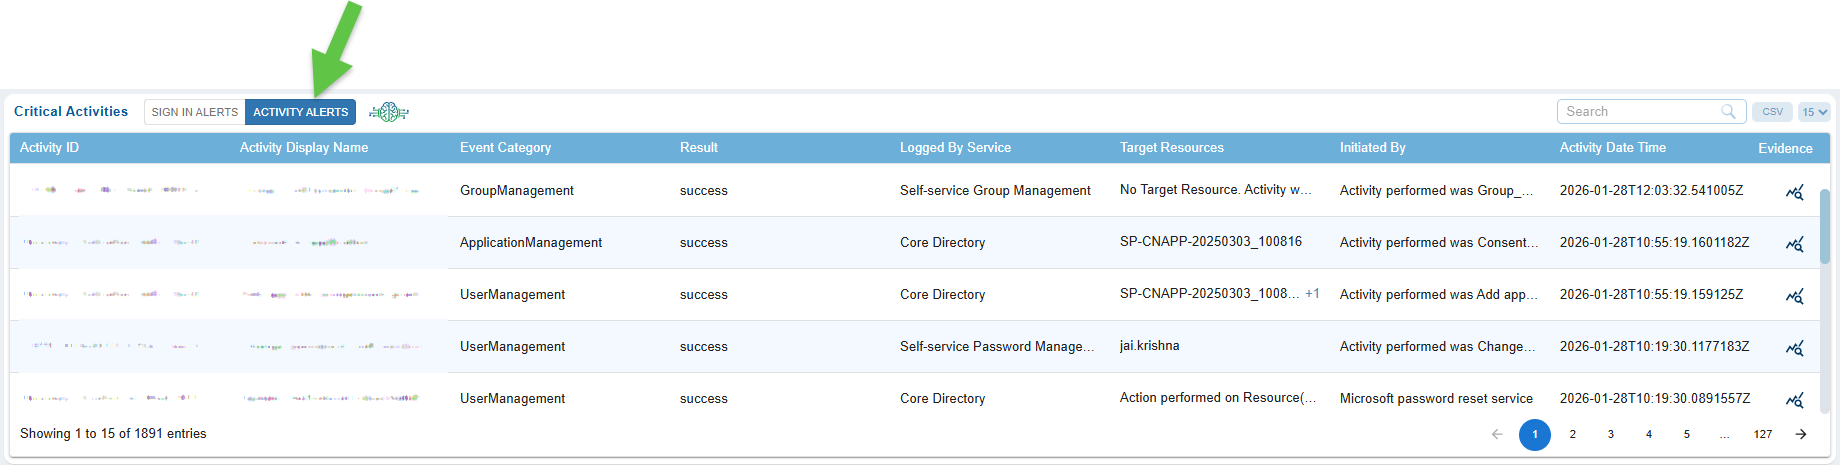
Saner Cloud uses Azure API to fetch the audit logs from the cloud service provider and display on the CIEM dashboard as ACTIVITY ALERTS.
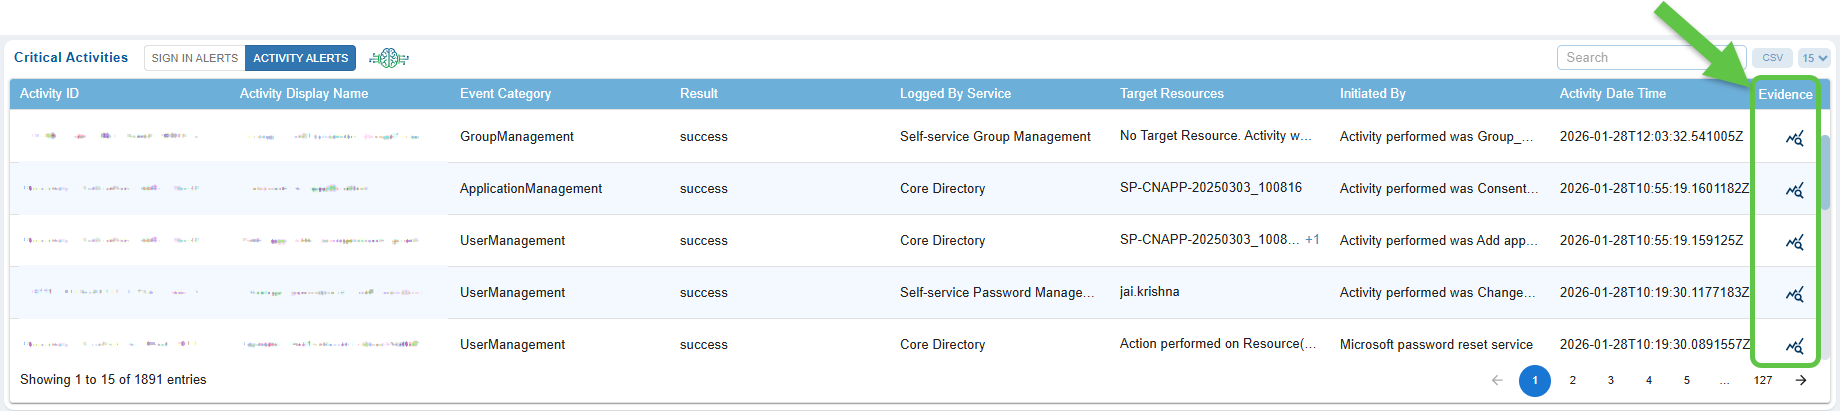
The Critical Activities “Activity Alerts” view provides a concise overview of high-risk or sensitive operations happening across your cloud environment.
Each column helps security teams quickly recognise key information such as what occurred, who carried out the action, which resource was affected, and whether the activity demands further investigation. By analyzing these fields, analysts can trace the origin and outcome of unusual or potentially harmful activities, along with the supporting evidence.
| Column | Description |
|---|---|
| Activity ID | A unique identifier automatically assigned to each logged activity. This ID helps track, correlate, and reference specific alerts during investigations or audits. |
| Activity Display Name | Label describing the action performed, for example, Role Assignment, Resource Deletion, or Privilege Modification, making it easier to understand the nature of the activity at a glance. |
| Event Category | Indicates the broader classification of the activity, such as Administrative, Security, Access Management, or Configuration. This grouping helps analysts prioritize actions based on their severity or relevance. |
| Result | Shows the outcome of the activity, for example, Success, Failure, or Partially Completed. This helps identify unsuccessful attempts that might indicate misuse or intrusion attempts. |
| Logged By Service | Specifies which cloud service or platform generated the log entry, such as Azure AD, AWS CloudTrail, or GCP Cloud Audit Logs. This helps determine where the activity originated and provides context for cross-platform investigations. |
| Target Resources | Lists the resource(s) affected by the activity, for example, users, roles, compute instances, storage buckets, or identity objects. This shows what asset was impacted and may require further validation. |
| Initiated By | Displays the identity such as the user, service principal, workload identity, or automated process, that triggered the activity. This helps verify whether the activity aligns with expected permissions and behavior. |
| Activity Date Time | Represents the exact timestamp when the activity occurred, helping analysts trace event sequences, correlate logs, and identify patterns or anomalies. |
| Evidence | Clicking the Evidence icon in the Critical Activity Logs for Activity Alerts opens a detailed panel that consolidates all contextual and evidence-driven information related to the event. You get a comprehensive view of what occurred, who initiated it, which resource was affected, and how the system processed the action in different sections. The panel displays the event’s timestamp, description, category, logging service, correlation ID, and operation result. It also includes request-level details, such as the event ID, the involved profile or object, and its name. Additionally, the panel summarizes the final outcome recorded by the cloud service and provides further technical details, including the target tenant or subscription, entity type, and the identity type of the actor. |
Review Evidence Details for Critical Activity “Sign-In Alerts”
Evidence in the Critical Activity “Sign-In Alerts” view provides comprehensive details about any authentication event identified as high-risk. It consolidates essential information, including event timestamps, identifiers, client and device attributes, geolocation insights, and the final authentication outcome.
This data allows you to quickly determine whether a sign-in attempt is legitimate or potentially malicious.
Follow the steps below to review evidence details for a Sign-in alert:
Step 1: Access the Evidence for a “Sign-in” Alert Event
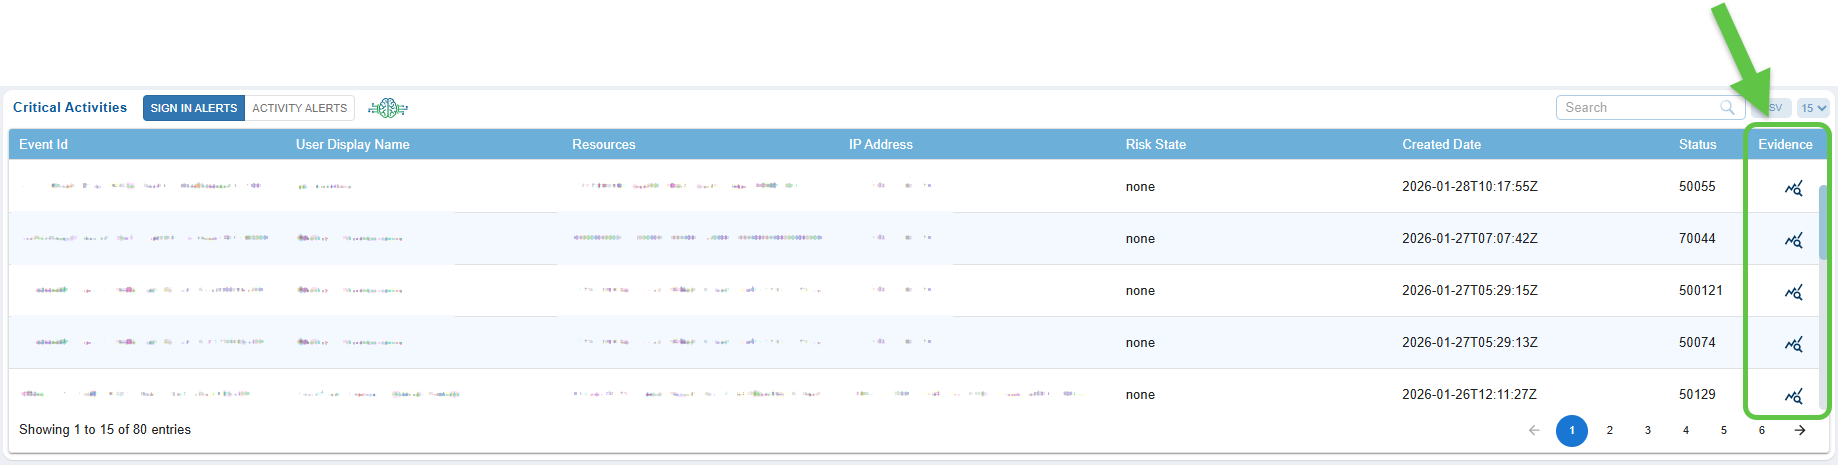
From the Critical Activity “Sign-In Alert” tab, click the Evidence icon specific to an Event ID.
Step 2: Verify “Sign-in Alert” Event Metadata
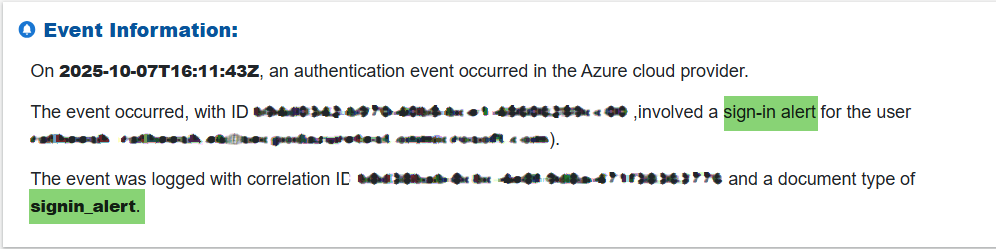
Review the timestamp, unique event IDs, and alert type to understand when the event occurred and how it was classified by the system.
Step3: Check “Sign-in Alert” Client and Device Information
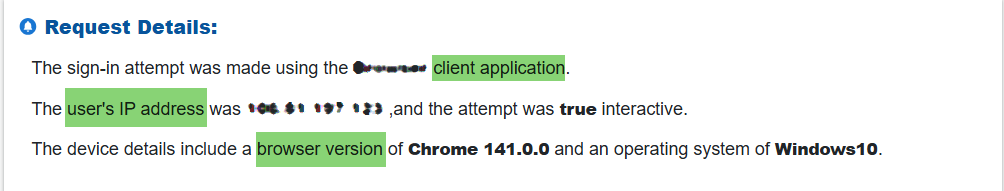
Examine key request details, including the client application used, originating IP address, browser version, and operating system. These indicators help determine whether the sign-in aligns with normal user behavior.
Step4: Review Sign-In Location
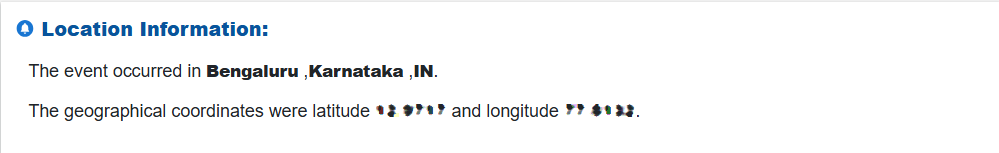
Assess the geographic details derived from the IP address, such as city, state, country, and latitude/longitude.
Unexpected or risky locations may signal suspicious activity.
Step5: Assess Authentication Outcome of the “Sign-in Alert”
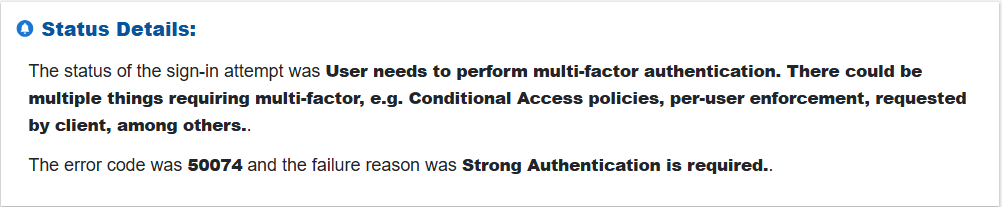
Look at the result of the sign-in attempt to see if it succeeded or failed. If failed, review any associated error codes or reasons, such as policy restrictions or MFA requirements, to understand the cause.
Review Evidence Details for Critical Activity “Activity Alerts”
Evidence for Activity Alerts provides a thorough and contextual overview of any flagged activity within your cloud environment. It consolidates event metadata, request attributes, impacted resources, and execution results to provide clarity on what occurred, who initiated the action, and how the system responded.
This comprehensive information facilitates quicker investigation, validation, and response to potentially risky or unusual activities.
Follow the steps below to review evidence details for an Activity Alert:
Step 1: Access the Evidence for a “Activity Alert” Event
From the Critical Activity “Sign-In Alert” tab, click the Evidence icon specific to an Event ID.
Step 2: Review “Activity Alert” Event Metadata
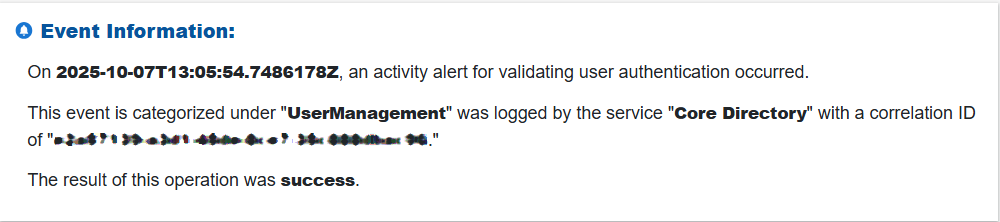
Examine the event timestamp, description, category, logging service, correlation ID, and operation result to understand the context and processing flow of the activity.
Step 3: Check “Activity Alert” Request-Level Details
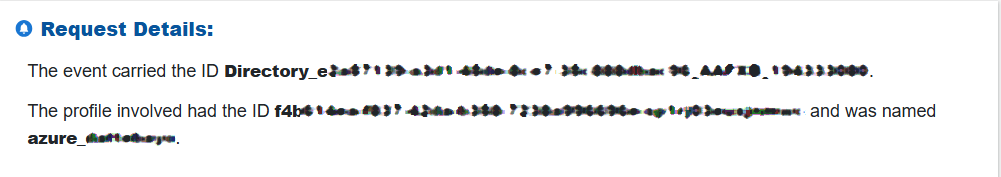
Look at the event ID, the involved object or profile, and the referenced name to identify who initiated the activity and what resource or entity was impacted.
Step 4: Verify “Activity Alert” Cloud Service Outcome
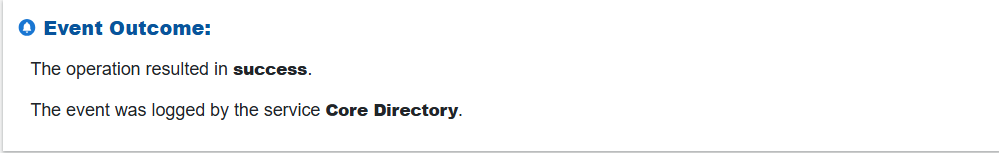
Review the final status recorded by the cloud provider, such as the operation succeeded, failed, or blocked, along with any supporting diagnostic information.
Step 5: Analyze Additional Technical Details of the “Activity Alert”
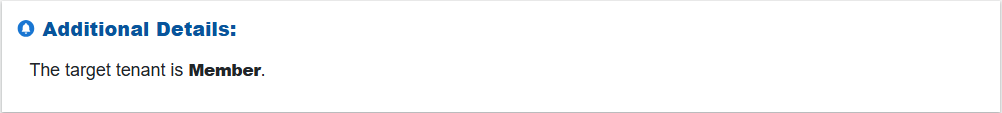
Inspect deeper technical details, including the target tenant or subscription, the entity type involved, and the identity type (user, service principal, or application) that executed the action.

