The Trend Chart offers a visual representation of Cyber Hygiene Scores (CHS) over time, allowing organizations to monitor and assess their overall security posture. It can be examined at both the organizational and account levels, helping stakeholders identify improvements, risks, and inconsistencies in cyber hygiene.
Analyze Organization-Wide Cyber Hygiene Score Trend
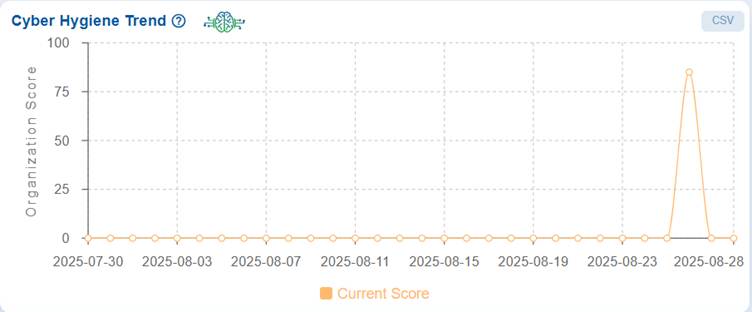
The Cyber Hygiene Trend graph displays the organization’s Cyber Hygiene Score (CHS) tracked over time.
The real-time example of dashboard view communicates that for most of the timeline, specifically from July 30, 2025, to August 25, 2025, the score remains consistently at 0, indicating a lack of measurable security posture or unavailability of data during that period.
On August 26, 2025, there is a significant spike, with the organization’s CHS reaching 85, suggesting an improvement in security hygiene. However, the score quickly drops back to 0 on August 28, 2025, reflecting instability in the organization’s cyber hygiene posture or possible inconsistencies in data collection, remediation, or configuration.
This pattern highlights that the organization’s overall security posture has been weak and inconsistent, with only a brief improvement observed. Continuous monitoring, sustained remediation, and validation are required to maintain a stable and reliable Cyber Hygiene Score over time.
Compare Current and Predicted Trend at Account-Level
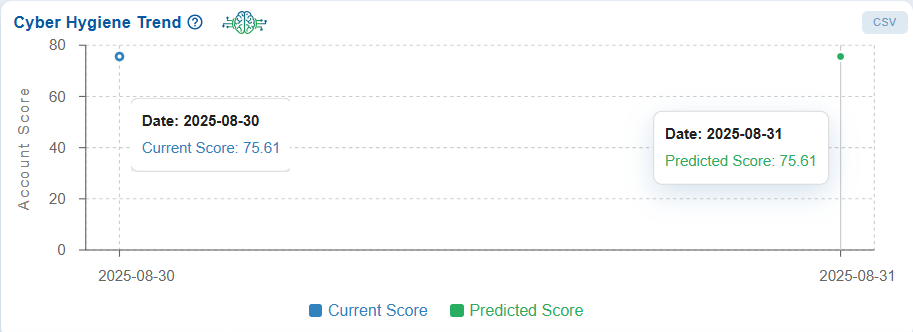
The Cyber Hygiene Trend graph displays the account scores over the past 30 days and helps compare the current scores to the predicted scores for the upcoming day.
The real-time example of dashboard view displays the evolution of the account’s security posture over a period.
This trend underscores the vulnerabilities that affected the security posture as well as the success of remediation efforts in restoring cyber hygiene.
See Also

