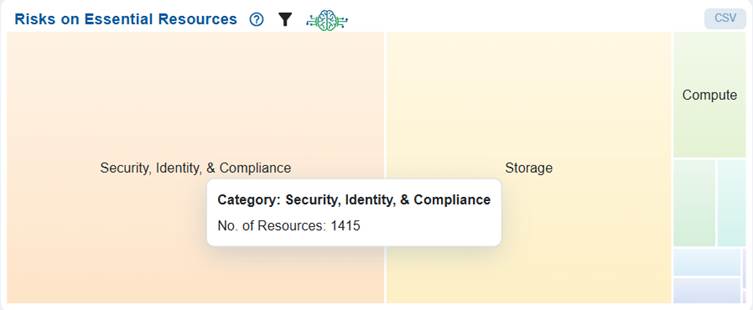
The Risks on Essential Resources chart utilizes a heat map to illustrate the proportion of risk associated with various types of resources, including Compute, Databases, Networking & Content Delivery, Analytics, Security & Compliance, and Storage.
Each block in the chart represents a resource category, with its size and shading indicating the relative level of risk. For example, the Security, Identity, & Compliance category comprises of around 1415 resources that’s at risk.
This visualization effectively highlights which categories contribute most to organizational risk, allowing for better prioritization of remediation efforts across different resource types.
Related Topics

