Saner Cloud offers a comprehensive Cyber Hygiene Scoring (CCHS) framework designed to help organizations measure and monitor their cloud security posture. The scoring consists of three components: Raw Score, Global Score, and Local Score, which together provide a complete assessment of risks across cloud environments.
To get started, users can access CHS from the CNAPP Infra(organization) or account level dashboards to gain deeper insights. At the organizational level, users can track their overall security posture, review cyber hygiene across various accounts, assess risk distribution among different cloud providers, and more. At the account level, users can access detailed insights, including the distribution of cyber hygiene scores across cloud environments, module-wise risk analysis, key issues leading to score decreases, security details at the resource level, and more.
Saner Cloud also enables organizations to analyze risks from multiple perspectives. This includes identifying high-risk resources based on their geo-location, evaluating service-level risks through CHS scores, assessing resource health by severity, monitoring trends in resource risk, and analyzing changes in cyber hygiene scores over time. These features allow organizations to identify vulnerabilities, prioritize remediation efforts, and effectively strengthen their overall cloud security posture.
Follow the links to perform the requisite action from the organization or account level dashboard views.
Organization Level
- Cyber Hygiene Score
- CHS based on Cloud Provider
- Cyber Hygiene Trend
- CHS Account Overview
- Resources Severity Distribution
- Risk Percentage based on Resource Category
Account Level
- Cyber Hygiene Score
- CHS Distribution
- Cyber Hygiene Trend
- CHS Resource Overview
- Resources Severity Distribution
- Risk Percentage based on Resource Category
- Top 10 Services by Risk
- Resource Risk Trend
- Concerning Resources Based on Geo Locations
- Top 5 Contributors
Saner Cloud Cyber Hygiene Scoring Approach
The Cyber Hygiene Score framework utlilizes three key scoring mechanisms: Raw Score, Global Score, and Local Score, to assess the security posture of a resource.
Here’s a quick look at each of these scoring mechanisms:
Raw Score
A Raw Score is a measure of a resource’s total attack surface that is independent of context. It is calculated across four dimensions: misconfigurations (Cloud Security Posture Management – CSPM), posture anomalies (Cloud Security Posture Anomaly – CSPA), missing patches (Cloud Security Risk Management – CSRM), and identity-related issues (Cloud Infrastructure Entitlement Management – CIEM). The score can theoretically range from zero to infinity. Users have the flexibility to assign custom weightings to each dimension, with the default setting being 25% for each. A higher Raw Score indicates greater exposure and lower security for the resource.
Global Score
The Global Score is a standardized metric that is derived from the Raw Score and is inversely related to it. It ranges from 0 to 100, but in practice, it usually falls between 0.96 and 99.6. A higher Raw Score leads to a lower Global Score, indicating a decrease in the security of the resource.
A score of 100 is deliberately excluded, as no resource can ever be considered 100% secure in real-world scenarios.
Local Score
Local Score is a percentile-based metric that reflects a resource’s security posture in relation to other similar resources within a specific account. It is derived from an inverse transformation of the Raw Score, meaning that as the Raw Score increases, the Local Score decreases, indicating weaker security. Since the Local Score is dependent on the account, the same resource can have different Local Scores across different accounts. The most secure resource is assigned a score of 100, while the least secure receives a score of 0.
Get Started
Saner Cloud offers easy access to the Cyber Hygiene Score (CCHS) through various dashboards, allowing organizations to quickly assess their security posture. Users can view the score from either the Organization-Level (or Infra Dashboard) by clicking on the Cyber Hygiene Score view, which provides a comprehensive overview of security across the enterprise. Additionally, the score can be accessed from the Account-Level Dashboard for more detailed insights related to a specific account. This flexibility ensures that both high-level organizational trends and detailed account-level information are readily available for continuous security monitoring.
Access CCHS from the CNAPP Infra(Organization) Dashboard
To access CCHS, just go ahead and click the Cyber Hygiene Score view from the CNAPP Infra(Organization) dashboard.
CNAPP Infra Dashboard
Access CCHS from the Overall Account-Level Dashboard
To access CCHS, just go ahead and click the Cyber Hygiene Score view from the Account-level dashboard.
Configure Account Weightage
The Account Weightage Configuration in CHS helps specify how different risk dimensions, such as Identities & Entitlements, Posture Anomalies, Misconfigurations, and Missing Patches, affect the overall score.
By adjusting these weightings, organizations can align their Cyber Hygiene Score with their security priorities, ensuring an accurate representation of risk. This approach helps direct remediation efforts toward the most significant areas, ultimately making the cyber hygiene score a more tailored and actionable measure of security posture.
Configure Current and New Weightage for CHS
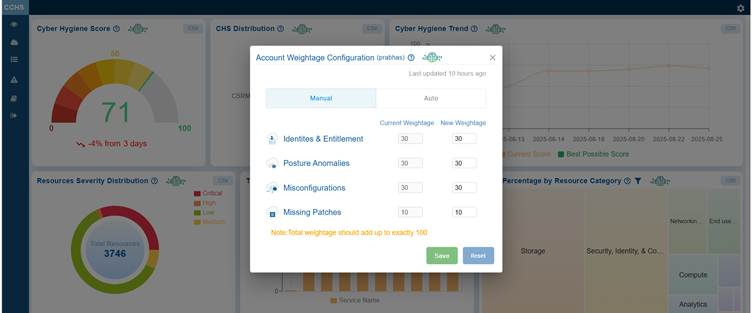
The Manual option in Account Weightage Configuration allows administrators to assign custom weightage to key risk dimensions such as Identities & Entitlements, Posture Anomalies, Misconfigurations, and Missing Patches.
It is essential that the total weightage adds up to 100. In-order to do this, see the Current weightage and accordingly adjust the New Weightage, increase or decrease a numeric value using the up and down arrow buttons, or enter a number directly into the field and save your settings.
Assign Weightages Using the Slider
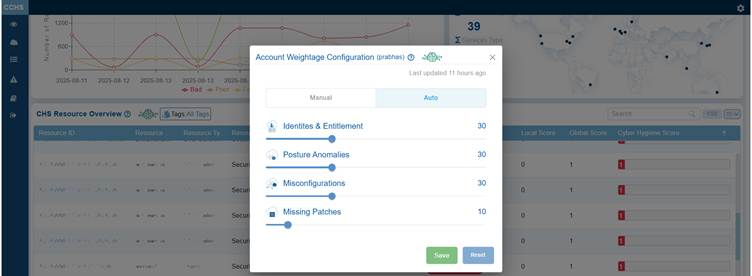
To assign the weightage from the Auto option, just move the slider corresponding to risk dimensions, such as Identities & Entitlement, Posture Anomalies, Misconfigurations, and Missing Patches, and save your settings.
Explore the Dashboard Views at Organization and Account Levels
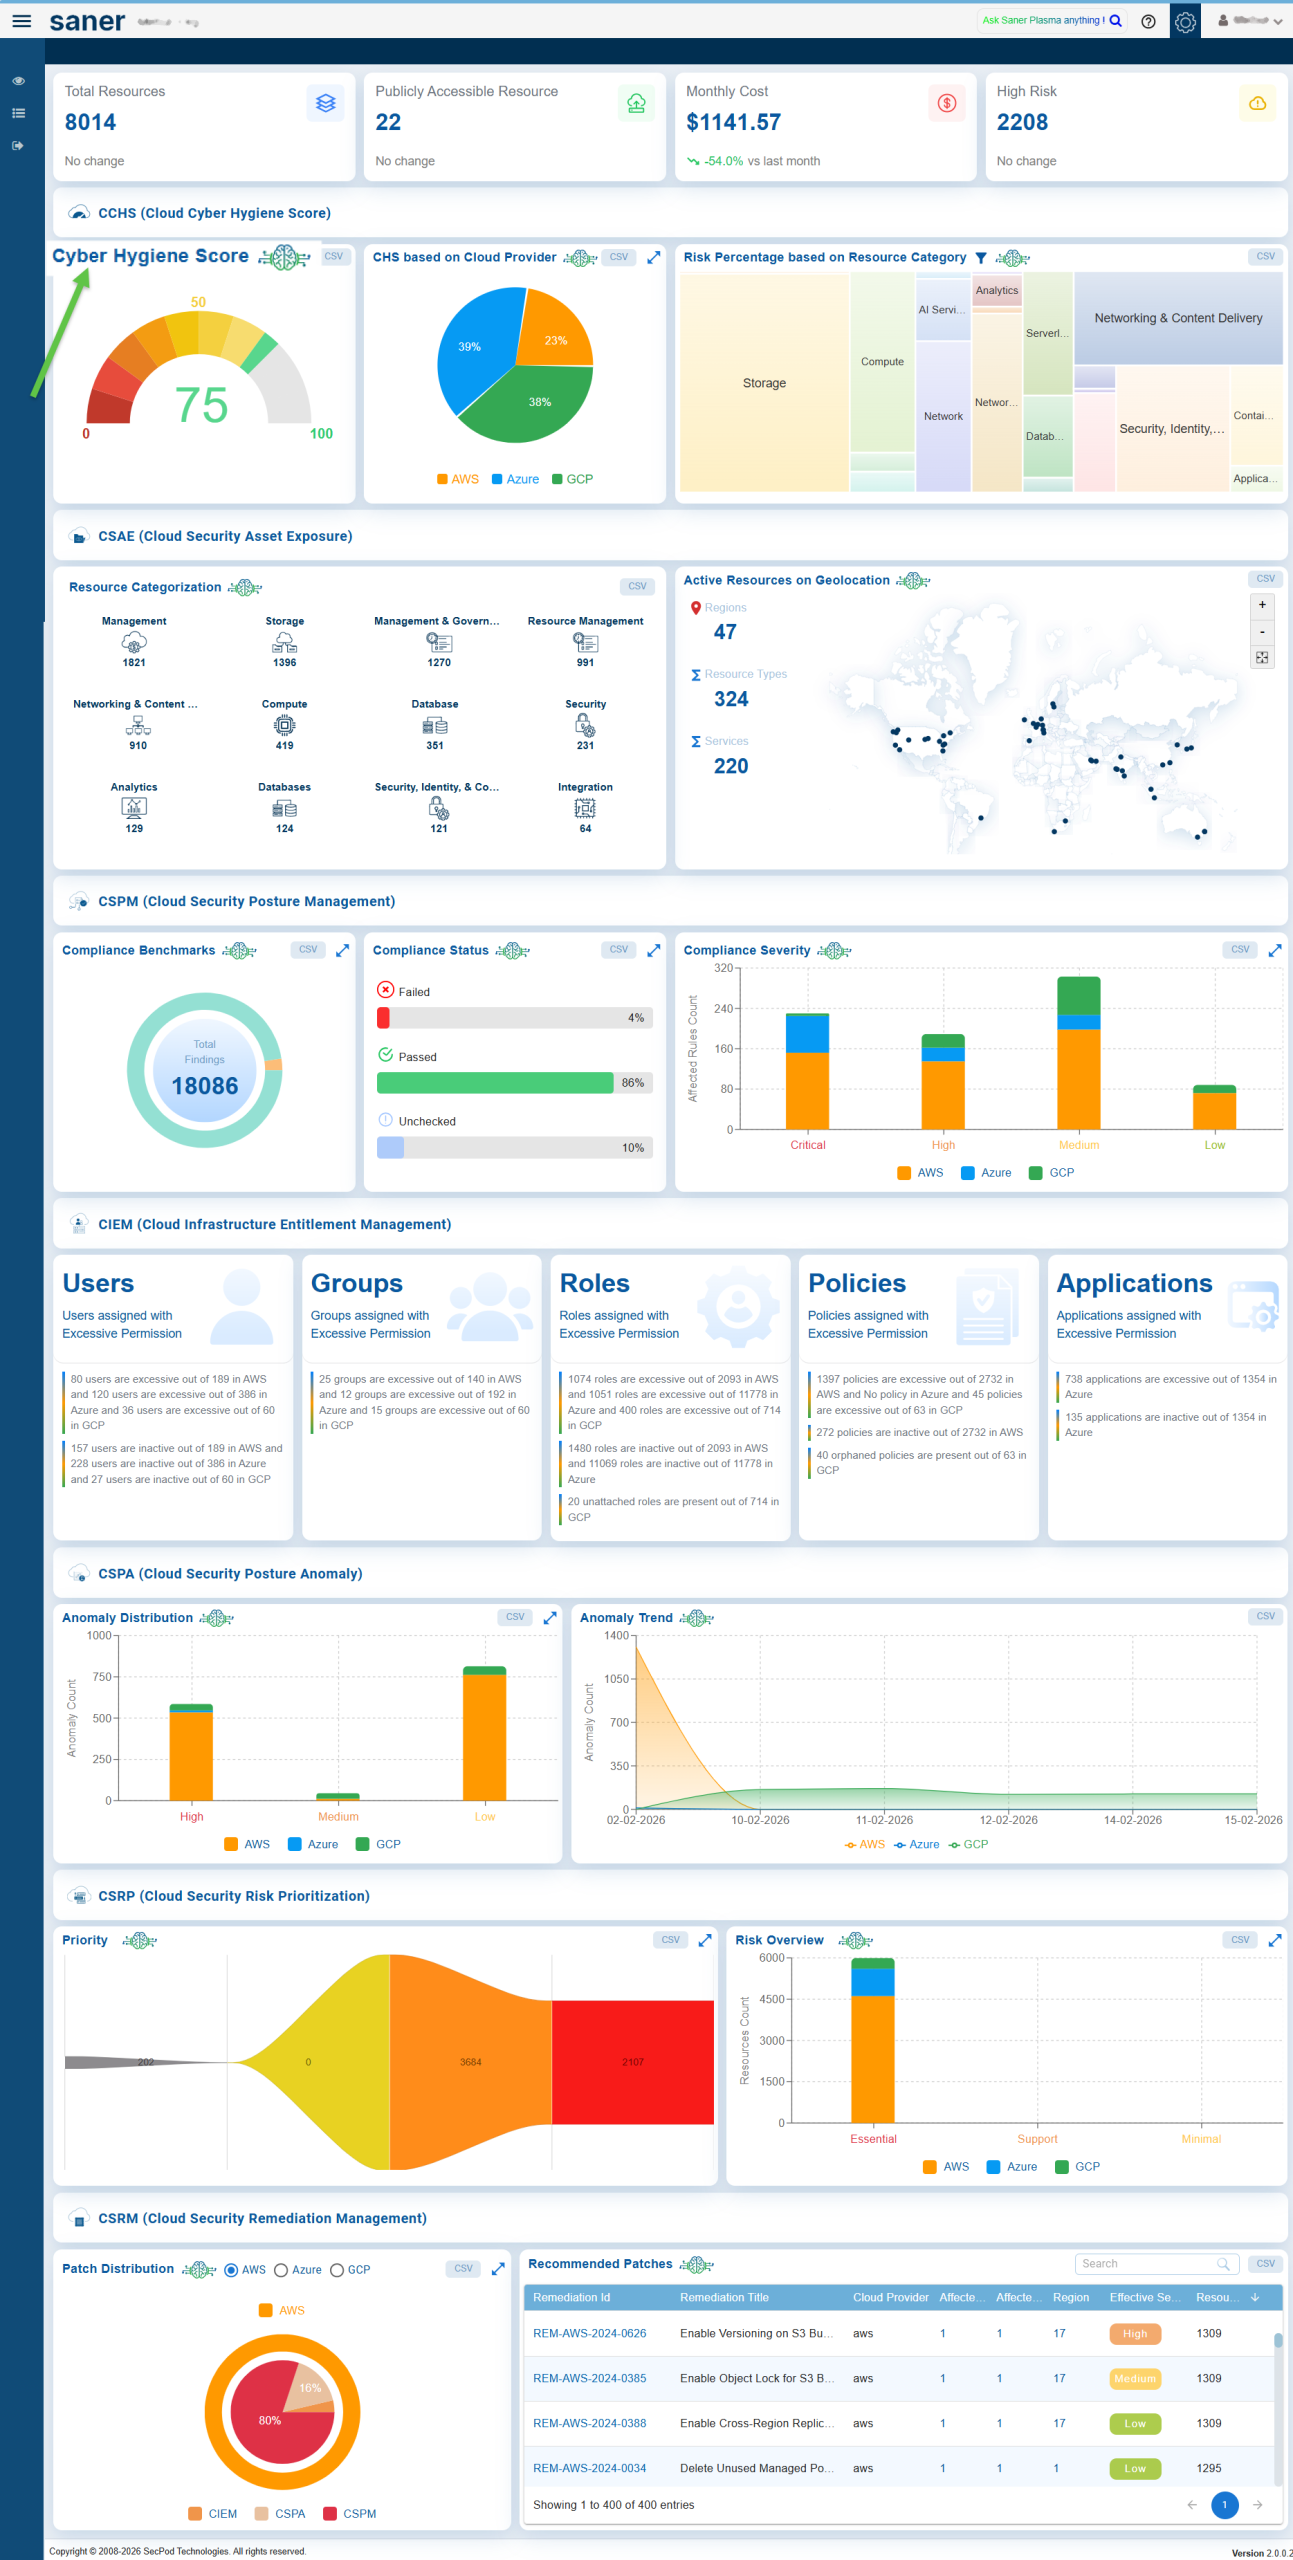
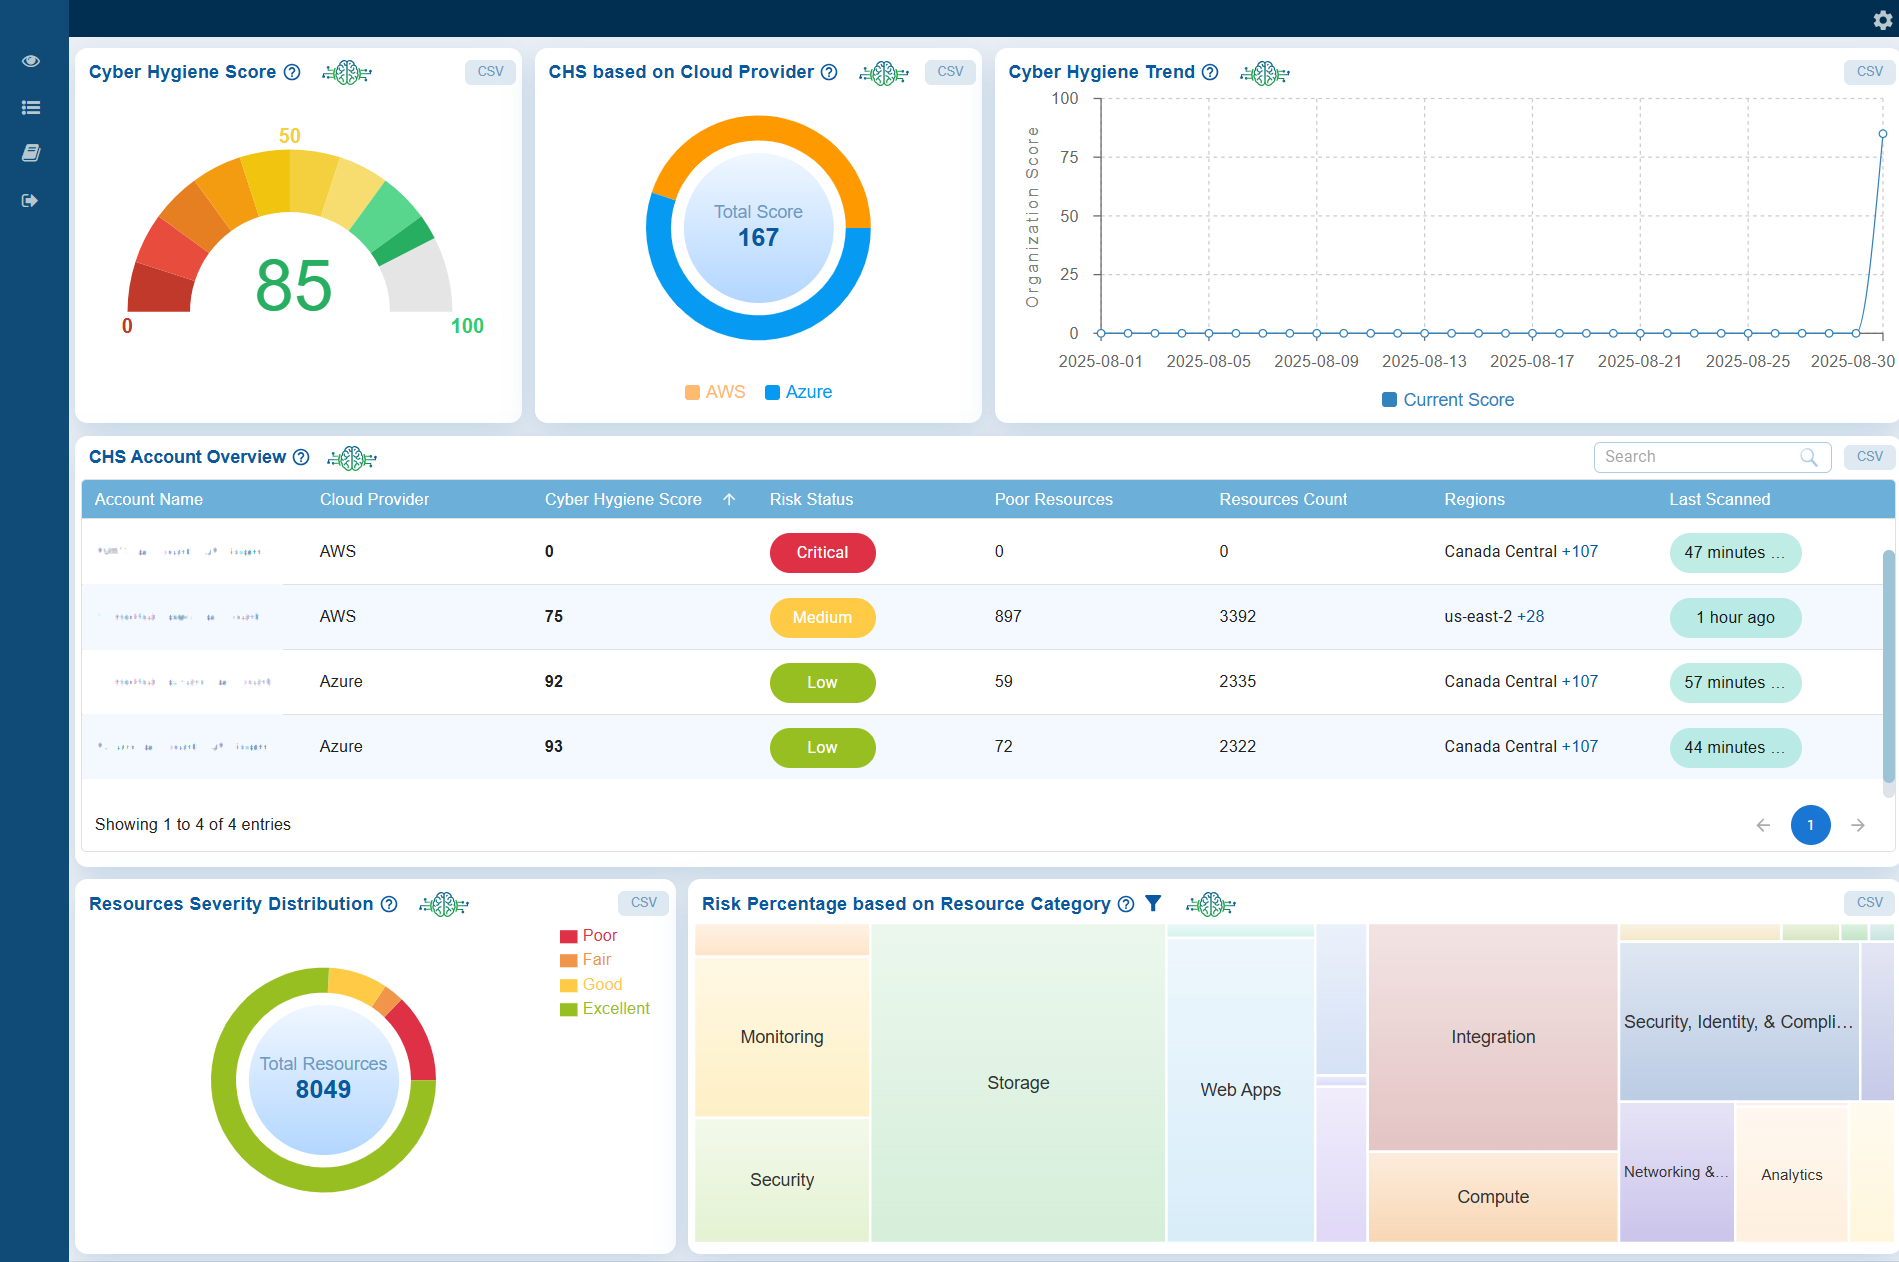
Saner Cloud offers comprehensive dashboard views that enable you to monitor, analyze, and enhance your organization’s overall security posture. At the organizational level, the dashboard highlights key metrics, including the overall Cyber Hygiene Score (CHS), its distribution across cloud providers, trend analysis, account-level overviews, resource severity distribution, and risk percentages by resource categories.
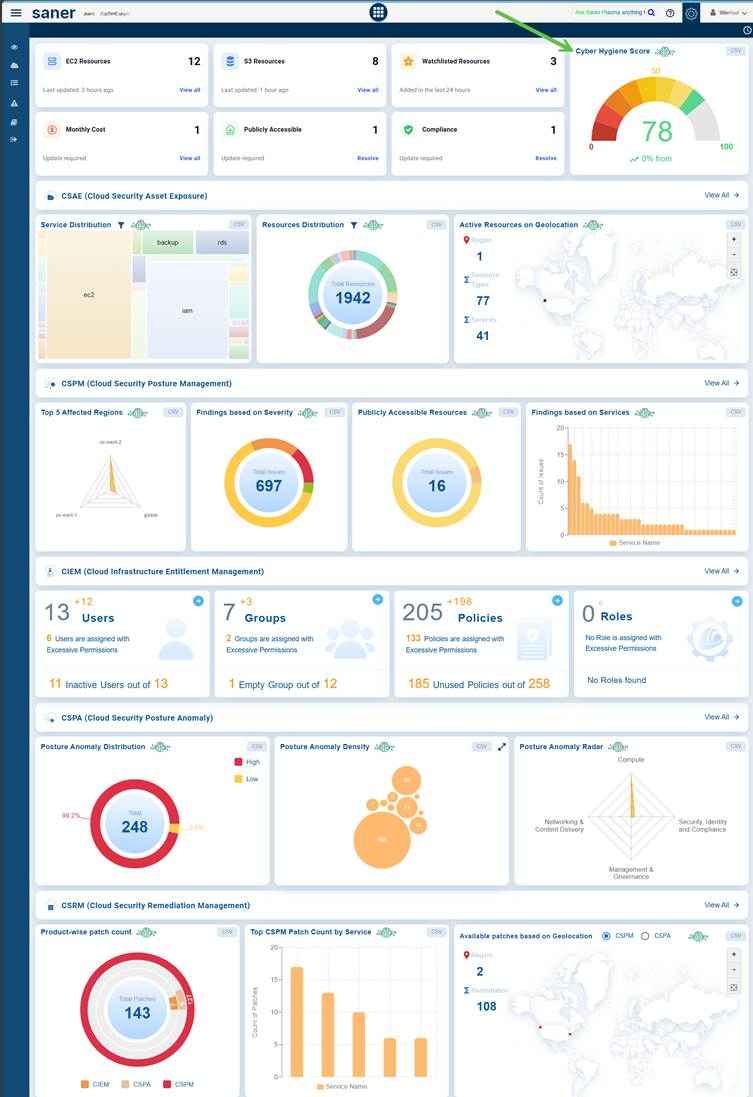
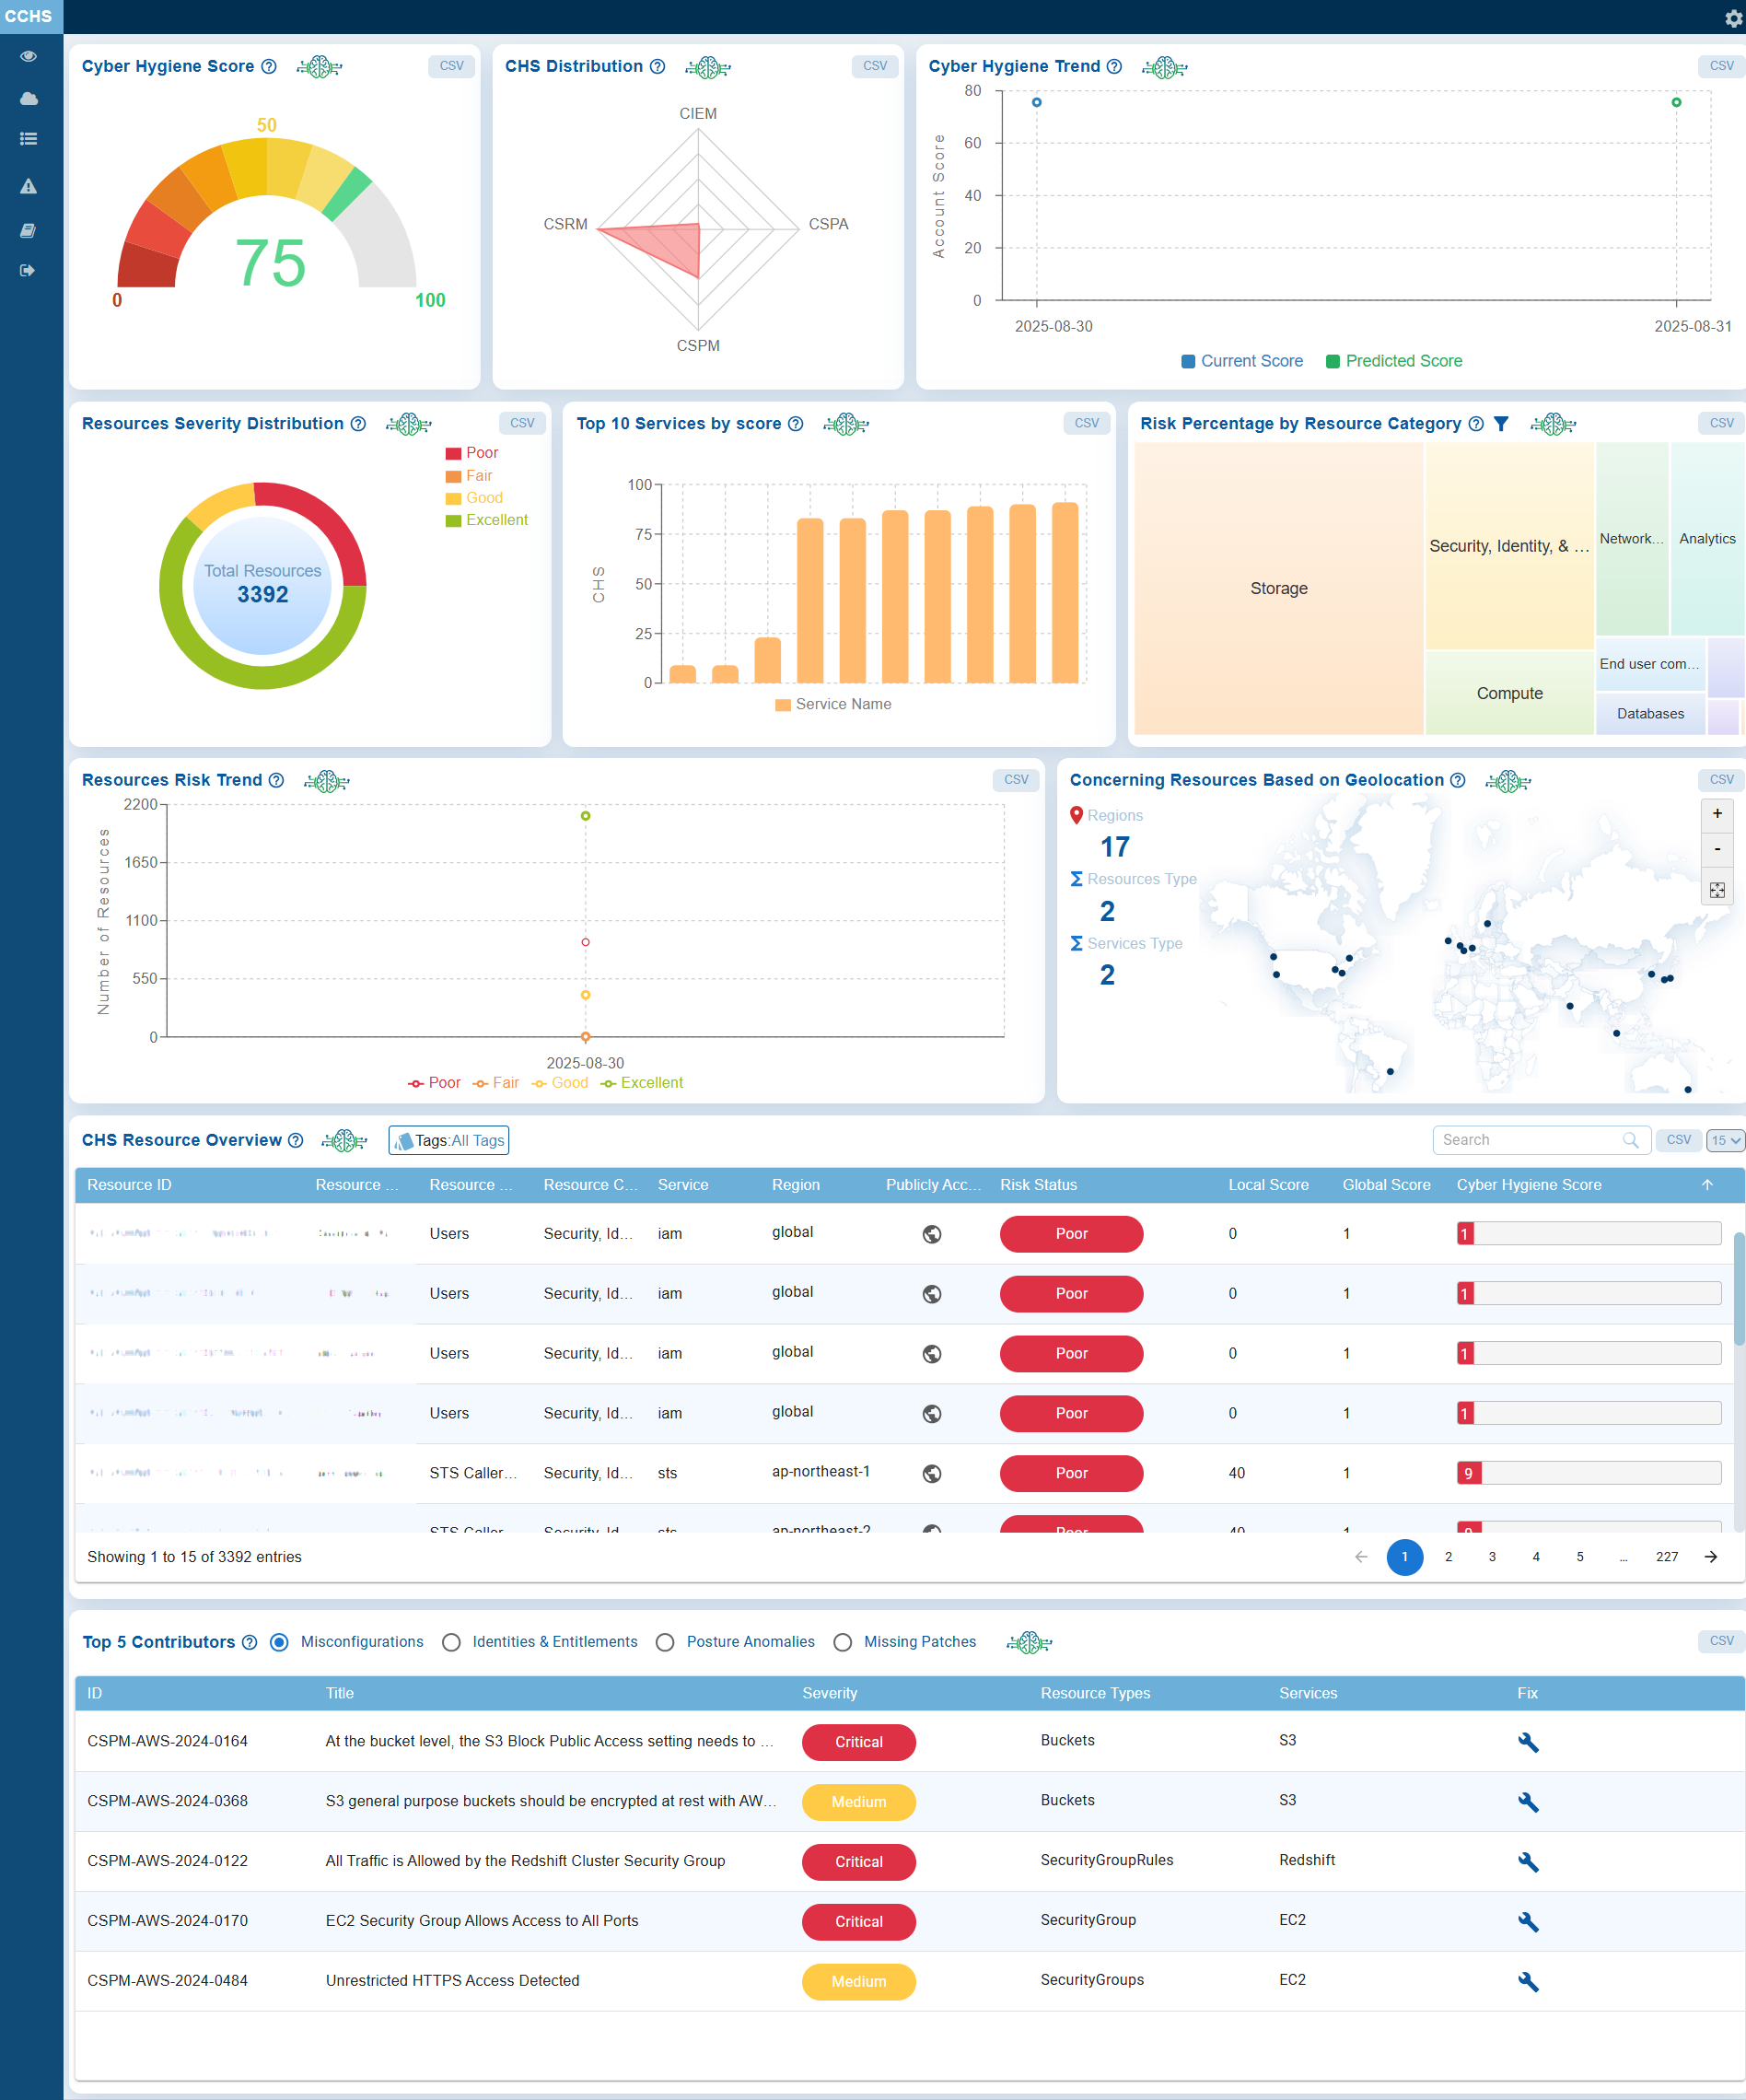
At the account level, the dashboard provides deeper insights into individual accounts, showcasing CHS distribution, hygiene trends, detailed resource overviews, severity breakdowns, category-wise risk percentages, and critical risk indicators. These indicators include the top 10 services by risk, resource risk trends, concerning resources based on geolocation, and the top 5 contributors affecting the score.
This dual-level visibility allows security teams to monitor posture both comprehensively at the organizational level and in detail at the account level, facilitating proactive and informed risk management.
Take a Glance at the Organization-Level Dashboard
Take a Glance at the Account-Level Dashboard
Track Security Posture with Cyber Hygiene Score
The Cyber Hygiene Score (CHS) in Saner Cloud allows you to continuously monitor and assess the security posture. By offering measurable insights into cloud security health, the CHS tool aids in identifying risks, tracking improvements, and ensuring proactive compliance at both the organization-level and account-level.
Interpreting the Score
| Score Range | Risk Level | Interpretation |
|---|---|---|
| 0-10 | Critical Risk | The organization’s security posture is extremely weak. Most cyber hygiene controls are missing or ineffective. Immediate and comprehensive remediation is required to prevent breaches. |
| 10-20 | Very Poor | Security posture is severely weak. Core hygiene practices like patching, access control, and configuration management are largely neglected. Urgent action is needed to reduce exposure. |
| 20–30 | Poor | Foundational security measures are inconsistent or poorly implemented. The environment remains at significant risk. Strengthen endpoint protection, update policies, and enforce compliance. |
| 30–40 | Below Average | Some basic controls exist, but many misconfigurations continue to exist. The system lacks regular monitoring and timely remediation. Focus on automating hygiene tasks and addressing recurring issues. |
| 40–50 | Fair | The organization has made some progress, but notable weaknesses remain. Implement continuous assessment, improve patch regularity, and tighten configuration baselines. |
| 50–60 | Average | Core hygiene practices are functional but not optimized. Security gaps exist due to inconsistent execution. Focus on proactive maintenance and periodic risk reviews. |
| 60–70 | Good | The cybersecurity hygiene is strong and reasonably consistent. Minor issues are present but do not pose major threats. Continue periodic audits and awareness programs. |
| 70–80 | Very Good | Most systems are well-maintained, with a strong culture of security hygiene. Only minor process or configuration improvements are required. Maintain routine monitoring. |
| 80–90 | Outstanding | The organization demonstrates excellent cyber hygiene maturity. Controls are effectively managed and continuously improved. Maintain the current strategy and validate resilience regularly. |
| 90–100 | Excellent | A model of cybersecurity excellence. Preventive and detective controls are optimized, and continuous improvement is embedded in operations. Sustain through ongoing innovation and threat intelligence integration. |
Cyber Hygiene Score at Organization Level
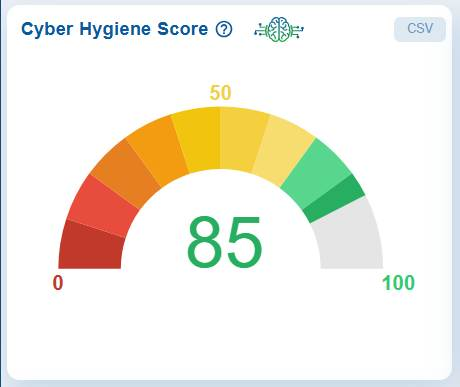
The Cyber Hygiene Score dashboard view displays the organization’s overall CHS as a weighted average of accessible account scores. The 0–100 scale offers a clear view of the current security posture.
The gauge features a color gradient ranging from red(indicating a low score) to green(indicating a high score), with 50 marking the midpoint.
Cyber Hygiene Score at Account Level
Displays the Cyber Hygiene Score trend over the past 30days.
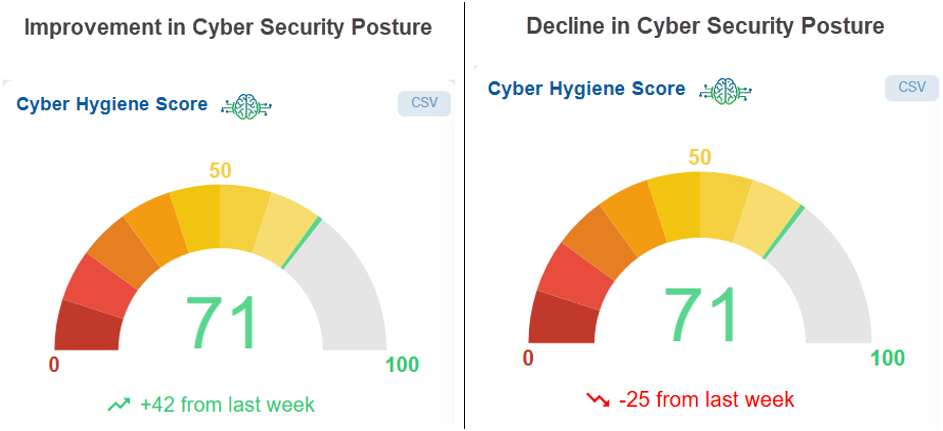
At the account level, the score for the current week shows an increase or decrease of +x OR -x points compared to previous measurement period, reflecting the change in the overall cybersecurity posture.
What does increase(+x) in CHS indicate?

The positive score in the Cyber Hygiene Score indicates that your organization’s overall security posture has improved compared to the previous measurement period.
A positive change in the Cyber Hygiene Score indicates an improved security posture, typically achieved by addressing vulnerabilities or misconfigurations, applying necessary security patches, enhancing access controls, eliminating insecure or unused assets, and adopting recommended security best practices.
In summary, higher score indicates reduced risk exposure and better alignment with cybersecurity standards.
What does decrease(-x) in CHS indicate?

The negative indicates a decline in cybersecurity posture, signalling the need for immediate investigation and remediation.
Additionally, there is an option to export data in CSV format for detailed analysis.
How does Saner Cloud Compute the Cyber Hygiene Score?
The Cyber Hygiene Score (CHS) for a resource is calculated as a weighted average of its Global Score and Local Score, with default weightings of 80% for the Global Score and 20% for the Local Score. The Global Score indicates the overall security posture of a resource, while the Local Score evaluates it in comparison to similar resources within the same account. Together, these scores provide a comprehensive view of both absolute and relative security. The CHS typically ranges from 0.96 to 99.6, with higher scores signifying stronger security hygiene.
View the Cyber Hygiene Score Distributed Across Cloud Environments
The CHS based on Cloud Provider chart illustrates how these scores are distributed across different cloud environments(AWS, Azure, and GCP) within your organization.
At Organization Level
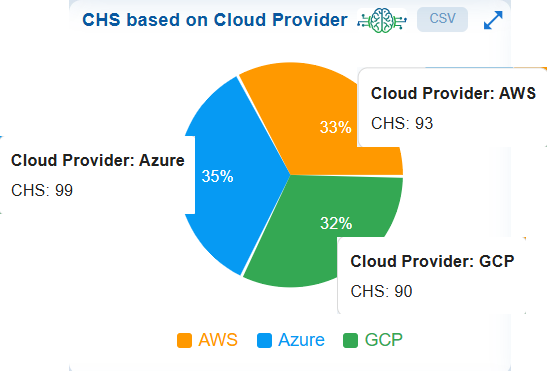
Each provider is represented by its corresponding score, making it easy to compare the security posture of each platform. This visualization helps identify which environments are performing well and which ones need further attention to enhance overall cloud security hygiene.
Analyze Module-wise Risk through CHS Distribution
The CHS Distribution presented as a Radar Chart illustrates the relative contributions of different modules, such as CIEM, CSPM, and CSRM to the organization’s overall risk posture.
At Account Level
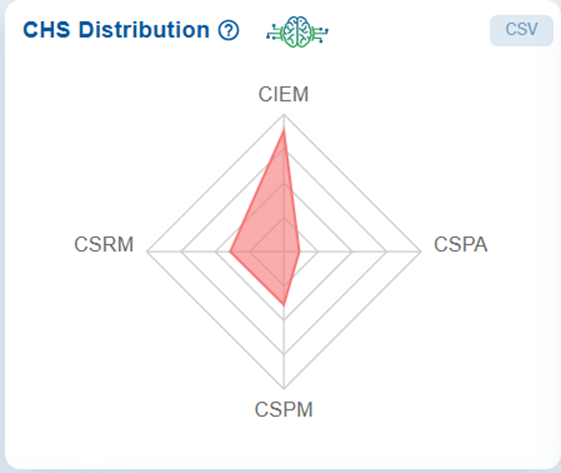
When you hover your cursor over the chart, the data point for the selected tool highlights, displaying its score marked by a red dot and further detailed in a tooltip. Each axis of the chart represents a specific security module, and the plotted points (for example, CIEM with a CHS Score of 4.43) indicates the strength or weakness in that particular area.
By visualizing the modules in this way, the chart highlights which areas contribute the most to potential attack vectors. It helps identify imbalances, weak points, and priority areas for remediation within the Cyber Hygiene framework.
The concentric levels on the chart represent different score ranges, facilitating a quick visual comparison of performance across tools.
Additionally, there is an option to download the data in CSV format.
To gain deeper insight into the factors(misconfigurations, identities, posture anomalies, and missing patches) contributing to bringing down the CHS score of the account, refer to the section: Top 5 Contributors for the decrease in cyber hygiene score.
Review Major Issues Contributing to the Drop of Cyber Hygiene Score at Account-Level
The dashboard block outlines the Top 5 Contributors for the decrease in cyber hygiene score.
At Account Level
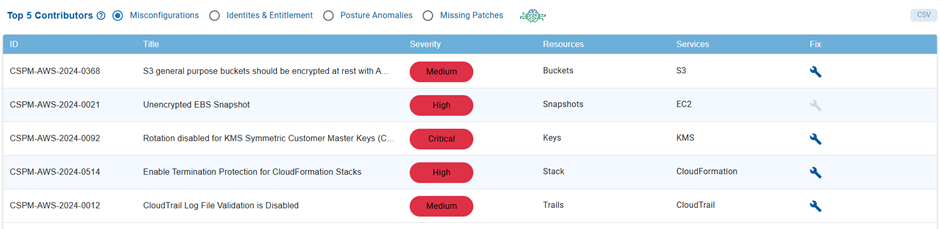
Issues display in a tabular format based on the Misconfigurations, Identities & Entitlement, Posture Anomalies, or Missing Patches that you choose.
| Column | Description |
|---|---|
| ID | Id corresponding to the relevant tool |
| Title | Brief title of the issue |
| Severity | Severity level of the issue. The severity classifications are categorized as Critical, High, Medium, and Low allowing for effective prioritization of remediation efforts |
| Resources | Impacted resources for the corresponding service |
| Services | Affected Cloud Service |
| Fix | Clicking the Fix icon redirects to the corresponding tool for remediation |
Additionally, the table offers search, navigation, and CSV export options to facilitate streamlined analysis and reporting.
Assess Risk Distribution for Different Cloud Providers
Saner Cloud allows organizations to evaluate the distribution of risks across various cloud providers at both the organizational and account levels. At the organizational level, it offers a consolidated view of risks across all connected providers, helping to provide a comprehensive understanding of the overall security posture. At the account level, it delivers a detailed breakdown of risks within individual accounts, enabling security teams to identify and effectively address specific vulnerabilities.
At Organization Level
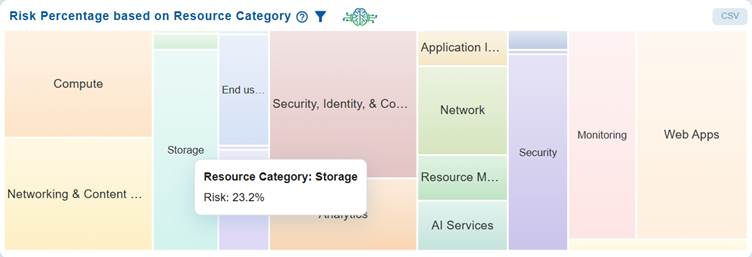
The Risk Percentage based on Resource Category chart utilizes a heat map to illustrate the proportion of risk associated with various types of resources across AWS, Azure, and GCP.
At Account Level
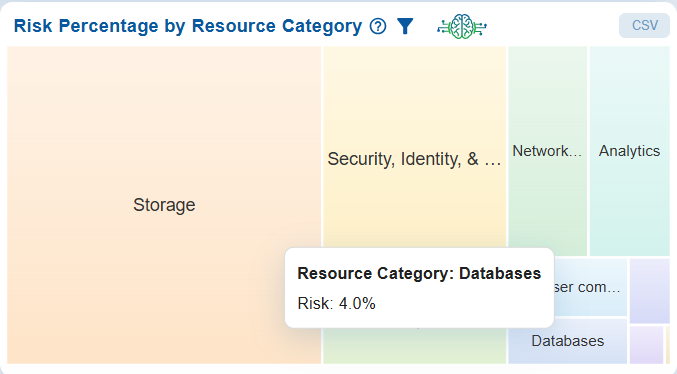
The Risk Percentage by Resource Category chart utilizes a heat map to illustrate the proportion of risk associated with various types of resources, including Compute, Databases, Networking & Content Delivery, Analytics, Security & Compliance, and Storage.
Each block in the chart represents a resource category, with its size and shading indicating the relative level of risk. For example, Databases account for 4.0% of the overall risk.
This visualization effectively highlights which categories contribute most to organizational risk, allowing for better prioritization of remediation efforts across different resource types.
Review Organization-Level Cyber Hygiene Across Accounts
At Organization Level
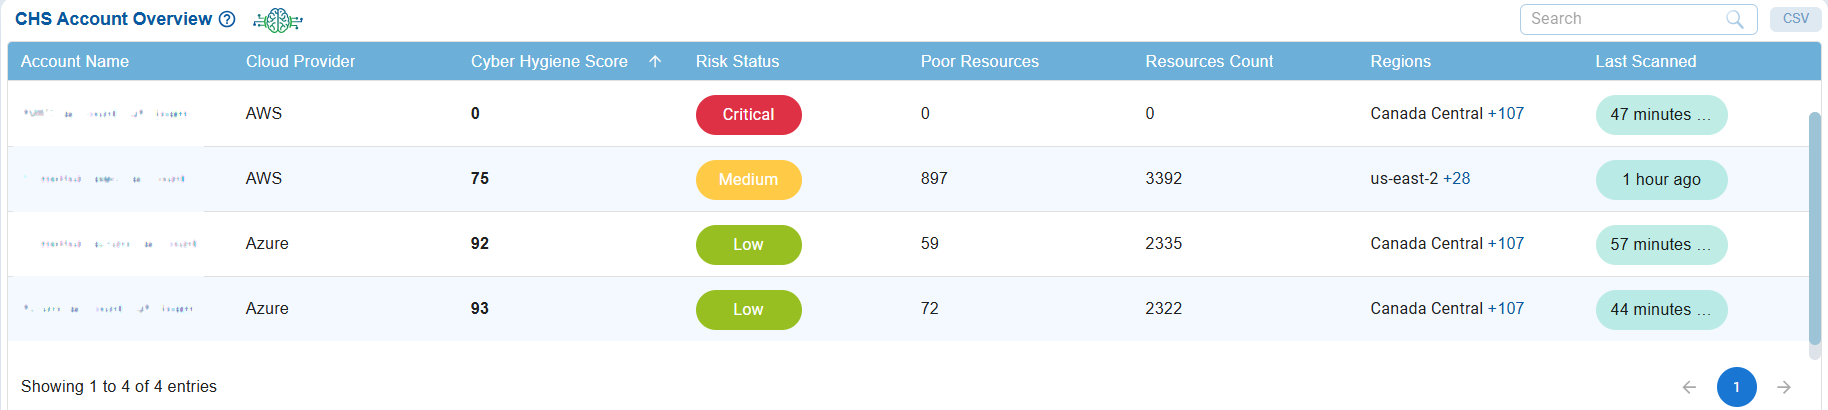
The CHS Account Overview table provides an organization-level view of Cyber Hygiene Scores across multiple cloud accounts. It compares these accounts by detailing their cloud provider(AWS, Azure, or GCP), CHS score, risk status, number of poor(critical) resources, total resource count, regions covered, and last scan details.
For instance, the AWS account has a CHS score of 75, which falls under medium risk severity and has 897 poor(critical) resources. In comparison, the Azure account has a CHS score of 92, indicating low risk status, with 59 poor(critical) resources. This overview enables organizations to identify which accounts have stronger or weaker security hygiene, prioritize their remediation efforts, and maintain a balanced security posture across their environments.
Get an Overview of Cyber Hygiene for Cloud Resources
At Account Level
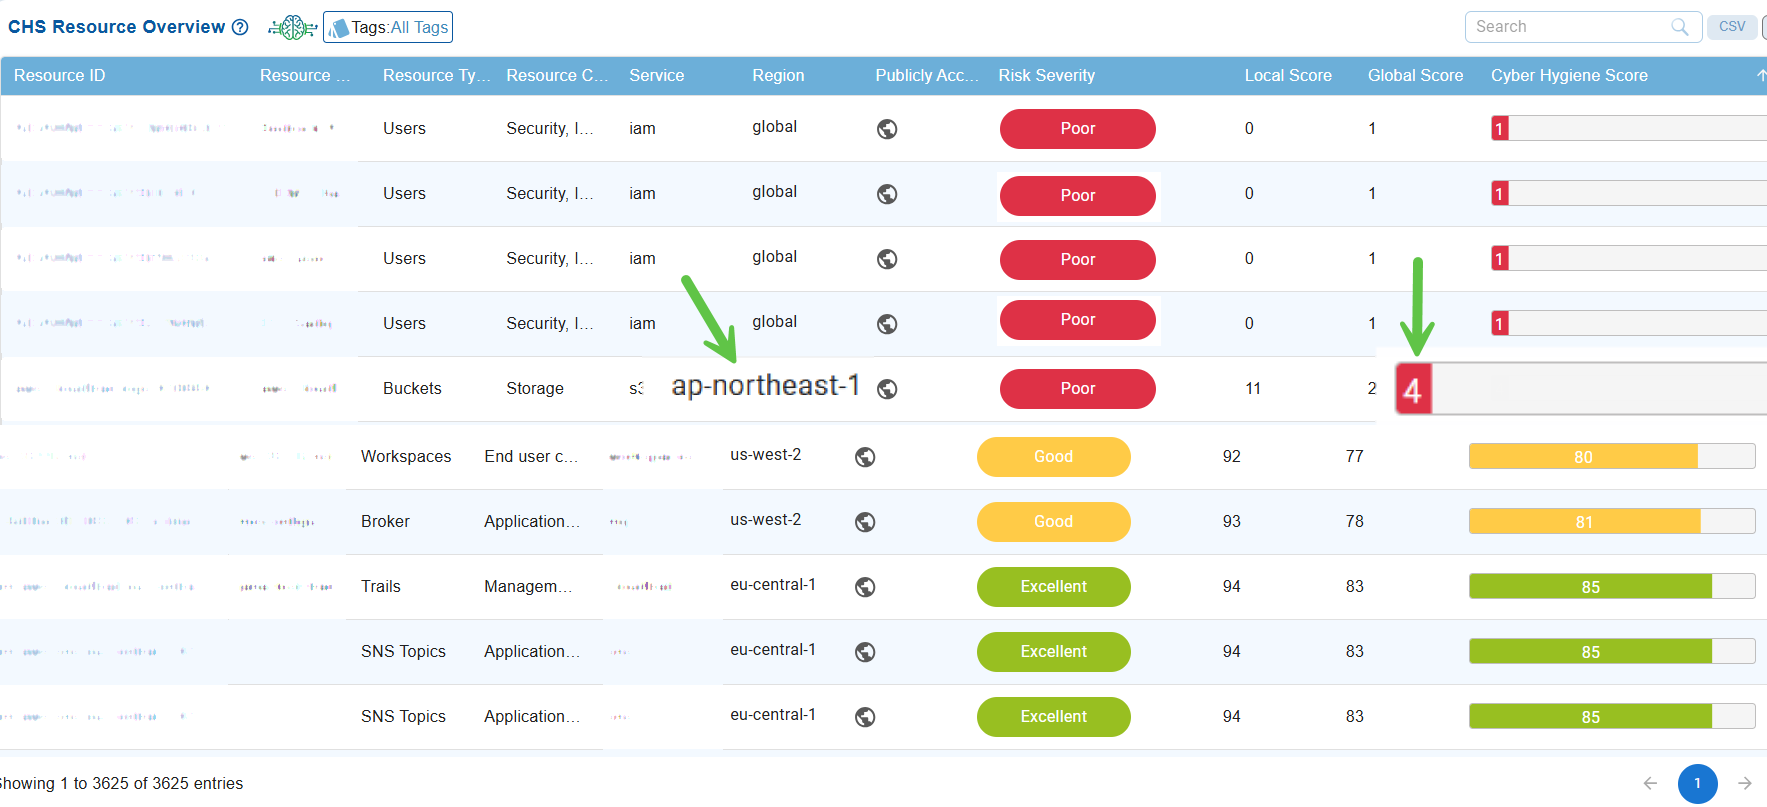
The CHS Resource Overview table provides a comprehensive list of cloud resources, including their IDs, names, associated services, regions, public accessibility status, and security posture scores.
The table displays both local and global scores, along with an overall Cyber Hygiene Score that features color-coded indicators for quick risk assessment.
Resources with lower CHS values, for example, the resource located in the ap-northeast-1 region with a cyber hygiene score of 4, indicate areas that require immediate attention. This information allows teams to focus their remediation efforts on the most vulnerable resources.
View Detailed Information of Selected Resource’s Security Posture
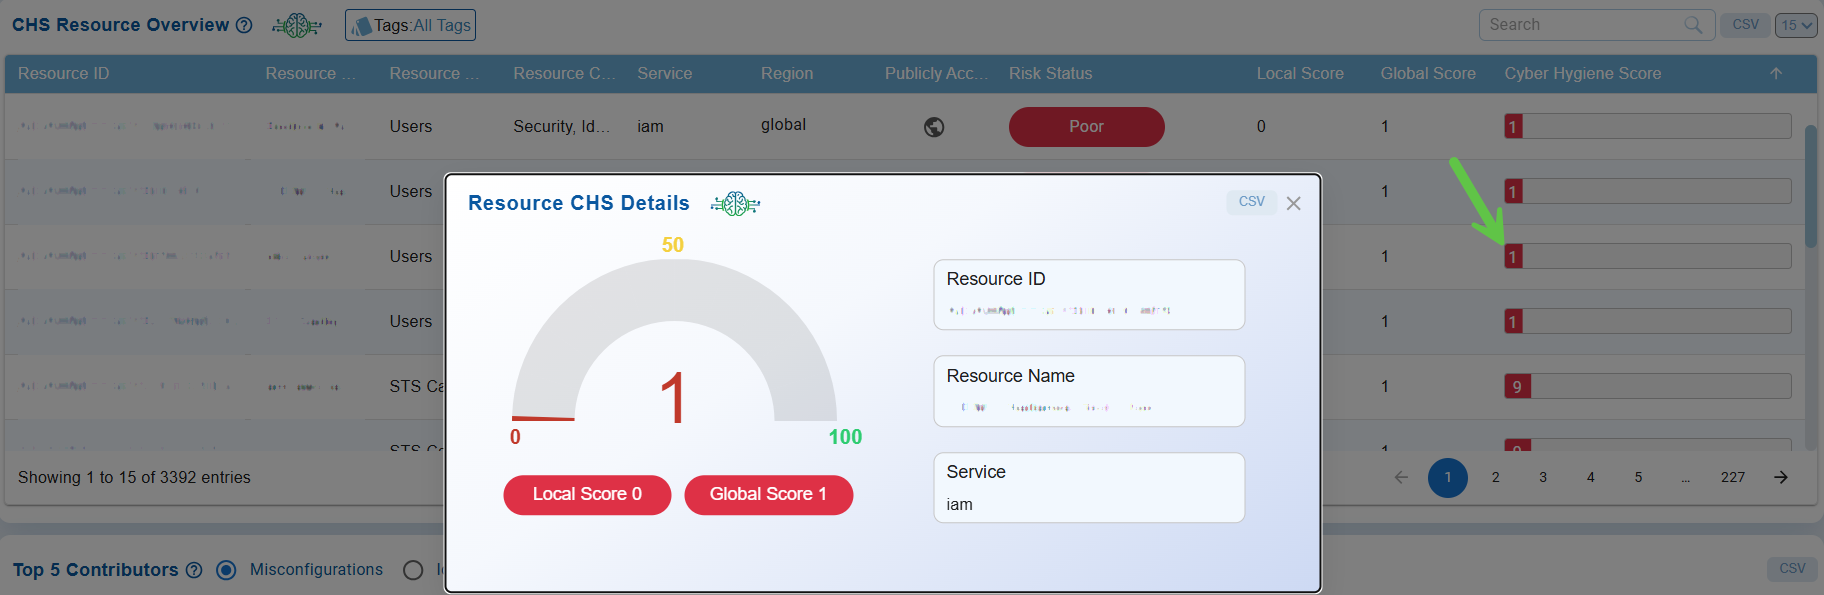
Clicking on a Cyber Hygiene Score in the CHS Resource Overview view opens a pop-up that displays detailed information about the selected resource’s security posture. This pop-up features a visual score gauge, as well as both local and global scores. Key metadata is also included, such as Resource ID, Resource Name, and Service Type. This detailed view allows users to quickly assess the health of individual resources, identify areas of weakness, and prioritize remediation actions to enhance overall cyber hygiene.
Filter Resources with Tags in CHS Resource Overview

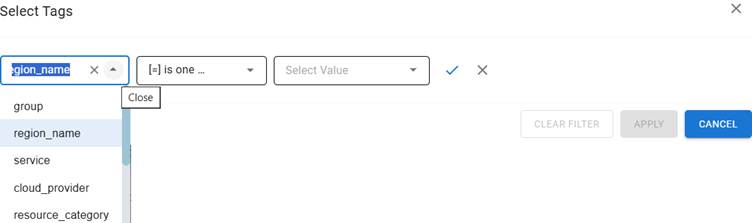
In the CHS Resource Overview block, tags act as metadata-based filters that help users organize and refine the displayed resources. By selecting tag categories such as region name, service, group, or cloud provider, and applying specific filter conditions, users can quickly narrow down the resource list to focus on relevant subsets.
This approach enhances the analysis of cyber hygiene scores by isolating critical resources based on factors like geography, service type, or organizational grouping. As a result, it streamlines security assessments and prioritization.
Search in CHS Resource Overview
The Search feature allows users to quickly find specific resources within the CHS Resource Overview table. By entering keywords, resource IDs, or partial strings, the table dynamically filters the results to display only the matching entries.
This functionality helps users easily locate a particular resource or group of resources without the need to manually scan through large datasets.
Identify High-Risk Resources by Geo Location
At Account Level
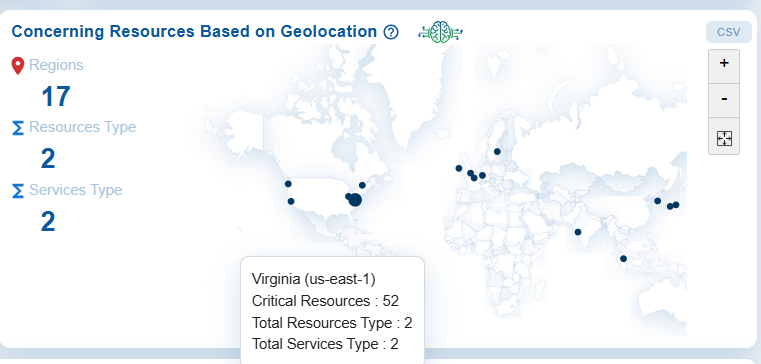
The Concerning Resources Based on Geo Locations chart highlights regions with the highest risk resources. It shows the distribution of these concerning(critical) resources and services across different regions, resource types, and service types, allowing organizations to evaluate the geographic concentration of risks. This information helps organizations proactively monitor regional risk exposure and take targeted remediation measures if risky resources are identified in specific geographic areas.
Markers on the world map indicate the physical locations of monitored resources, enabling a quick visualization of their geographic distribution across North America, Europe, and Asia. Moving your cursor on any of the dots displays the region, CHS score, total resources type, and total services type available in that specific region.
With zoom controls and the ability to export data as a CSV file, this dashboard block allows security teams to assess regional coverage, identify location-specific risks, and prioritize actions based on the distribution of resources and services.
Analyze Cyber Hygiene Scores through Trend Chart
The Trend Chart offers a visual representation of Cyber Hygiene Scores (CHS) over time, allowing organizations to monitor and assess their overall security posture. It can be examined at both the organizational and account levels, helping stakeholders identify improvements, risks, and inconsistencies in cyber hygiene.
Analyze Organization-Wide Cyber Hygiene Score Trend
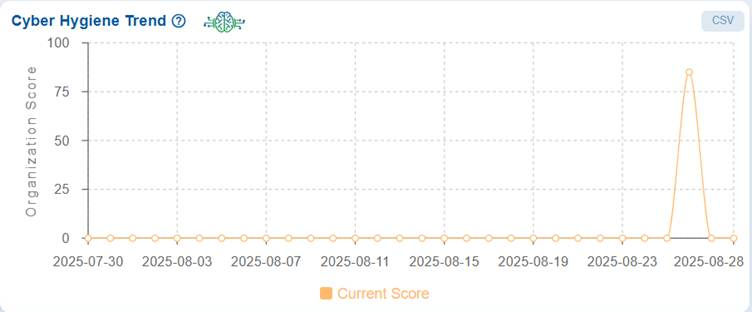
The Cyber Hygiene Trend graph displays the organization’s Cyber Hygiene Score (CHS) tracked over time.
The real-time example of dashboard view communicates that for most of the timeline, specifically from July 30, 2025, to August 25, 2025, the score remains consistently at 0, indicating a lack of measurable security posture or unavailability of data during that period.
On August 26, 2025, there is a significant spike, with the organization’s CHS reaching 85, suggesting an improvement in security hygiene. However, the score quickly drops back to 0 on August 28, 2025, reflecting instability in the organization’s cyber hygiene posture or possible inconsistencies in data collection, remediation, or configuration.
This pattern highlights that the organization’s overall security posture has been weak and inconsistent, with only a brief improvement observed. Continuous monitoring, sustained remediation, and validation are required to maintain a stable and reliable Cyber Hygiene Score over time.
Compare Current and Predicted Trend at Account-Level
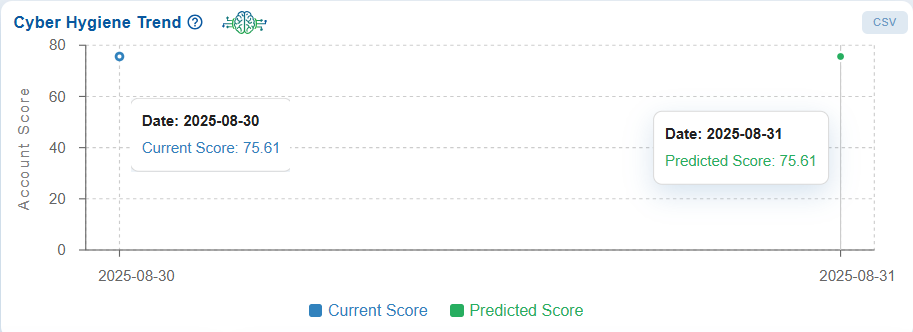
The Cyber Hygiene Trend graph displays the account scores over the past 30 days and helps compare the current scores to the predicted scores for the upcoming day.
The real-time example of dashboard view displays the evolution of the account’s security posture over a period.
This trend underscores the vulnerabilities that affected the security posture as well as the success of remediation efforts in restoring cyber hygiene.
Evaluate Service-Level Risks Using CHS Scores
The Top 10 Services by score chart illustrates Cyber Hygiene Scores (CHS) for various services in a bar chart format.
At Account Level
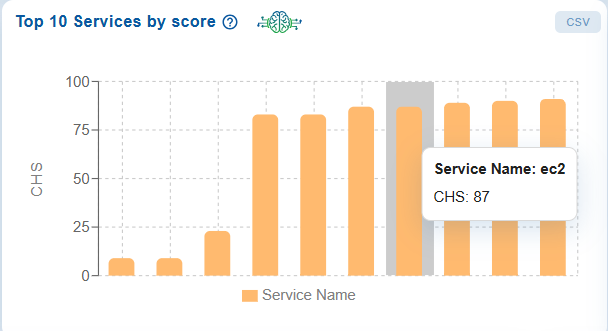
Services with lower scores indicate a higher risk, while those with higher scores demonstrate a stronger security posture.
For instance, the service “ec2” has a CHS score of 87, placing it in the mid-range for risk compared to other services. This visualization enables quick identification of the riskiest services, allowing for prioritized remediation efforts to enhance overall security.
Move your cursor over the bars in the chart to easily identify which services contribute the most to their respective cyber hygiene scores.
Assess Resource Health Through Severity Distribution
The Resources Severity Distribution chart shows how all resources are spread across 4 severity levels: Poor, Fair, Good and Excellent. This provides a quick overview of the overall condition of resources, highlighting areas that are performing well and those that may require closer attention. The chart helps in identifying priorities for improvement while also tracking the proportion of resources maintaining
Review Resource Distribution by Severity Levels at Organization-Level
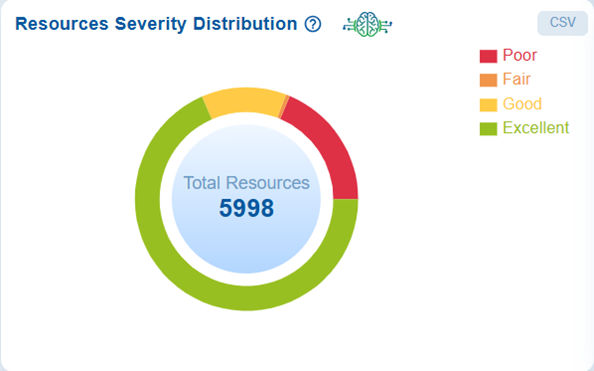
The Resources Severity Distribution chart displays the total count of resources categorized into 4 severity levels: Poor, Fair, Good, and Excellent. This visualization provides insights into the overall health and risk profile of organization-level resources. Additionally, this breakdown enables security teams to quickly identify critical areas that require immediate remediation, while also acknowledging the areas that are performing well in terms of cyber hygiene.
Review Resource Distribution by Severity Levels at Account-Level
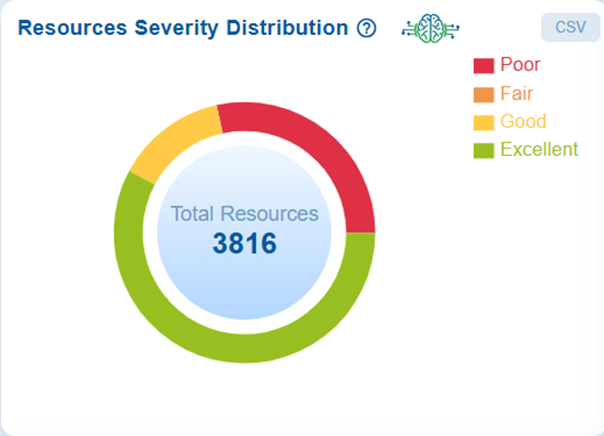
The Resources Severity Distribution chart displays the total count of resources categorized into 4 severity levels: Poor, Fair, Good, and Excellent. This visualization provides insights into the overall health and risk profile of account-level resources. Additionally, this breakdown enables security teams to quickly identify critical areas that require immediate remediation, while also acknowledging the areas that are performing well in terms of cyber hygiene.
Monitor Resource Risk Trends for CHS
The Resources Risk Trend graph tracks the movement of resources across various risk categories: Poor, Fair, Good, and Excellent. These transitions impact the overall Cyber Hygiene Score (CHS).
At Account Level
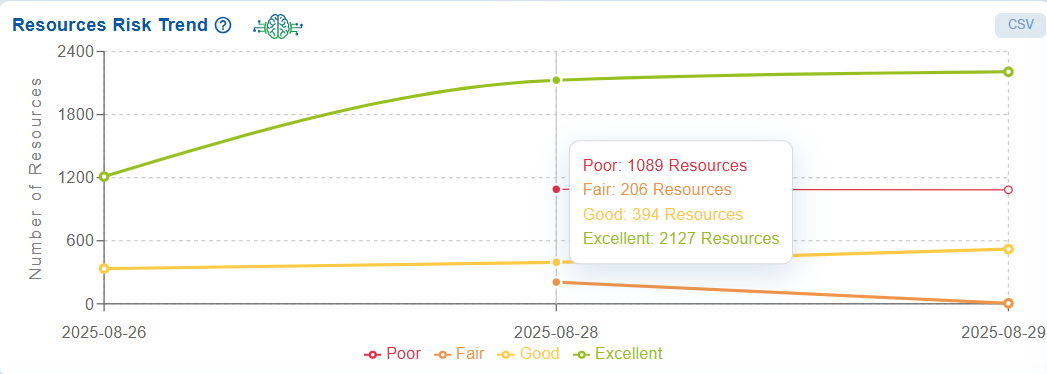
Move your cursor over the data point in the chart to display the latest count for the different risk categories in a tooltip.
This trend analysis is essential for evaluating the effectiveness of remediation efforts, monitoring changes in security posture, and prioritizing actions to enhance the overall cyber hygiene.
You also have an option to export the data into a spreadsheet by clicking the CSV button on the top-right of the block.
Commonly Asked Questions
What is the Cyber Hygiene Score (CCHS)?
The Cyber Hygiene Score is a metric used in Saner Cloud that measures the overall security posture of your cloud environment by evaluating factors like misconfigurations, posture anomalies, missing patches, and identity issues.
What are Raw Score, Global Score, and Local Score?
Raw Score: Measures the total attack surface across misconfigurations, identities, anomalies, and patches.
Global Score: A normalized metric (0–100) inversely derived from the Raw Score.
Local Score: A percentile comparison of similar resources within the same account.
How is the Cyber Hygiene Score calculated for each resource?
CHS is a weighted average of the Global Score (80% default weight) and Local Score (20% default weight).
What does an increase (+x) in CHS indicate?
An increase indicates improved security due to patching, fixing misconfigurations, removing risky assets, or enhancing access controls.
What does a decrease (–x) in CHS mean?
This signals a decline in posture and highlights the need for investigation and remediation.
How can I access the Cyber Hygiene Score dashboard?
You can access CCHS from the Organization-Level (CNAPP Infra) dashboard or the Account-Level dashboard by clicking on the Cyber Hygiene Score view.
What does the CHS trend chart show?
It displays how the organization’s or account’s CHS changes over time, helping identify improvements or deteriorations in posture.
How do I configure account weightage for CHS?
You can adjust weightage manually by entering numerical values, or automatically using sliders, ensuring the total adds up to 100.
What is shown in the CHS Resource Overview?
It lists all resources along with their service, region, local/global scores, CHS, and indicators showing risk severity.
What are the Top 5 Contributors in CHS?
A table that highlights issues causing score decline—misconfigurations, posture anomalies, entitlement issues, or missing patches.
Can I export CHS data?
Yes, most dashboard blocks allow CSV export for offline analysis and reporting.
What does the “Risk Percentage by Resource Category” chart show?
It displays risk contributions of resource types like compute, databases, networking, analytics, storage, etc., using a heatmap.
What is the purpose of the CHS Distribution Radar Chart?
It visually shows module-level risks for CIEM, CSPM, and CSRM, helping identify weak areas.
How does Saner Cloud identify high-risk geographic regions?
The geo-location map shows regions with the most concerning (critical) resources and their CHS scores.
What does the Resource Severity Distribution chart represent?
It categorizes resources into Poor, Fair, Good, and Excellent based on their CHS.
What does the Resource Risk Trend chart show?
It tracks how resources are moving between severity categories over time, reflecting remediation effectiveness.
How do filters and search work in CHS Resource Overview?
You can filter resources by region, service, cloud provider, tags, or keywords to quickly locate specific assets.
What does the “Top 10 Services by Score” chart show?
It ranks cloud services by CHS, helping you identify which services carry more risk.
Can CHS compare risk across cloud providers like AWS and Azure?
Yes, you can view CHS distribution based on cloud providers at both organization and account levels.
Why can’t a Global Score reach 100?
CCHS intentionally excludes a perfect score because no resource is ever considered 100% secure in a real environment.

