Manage Asset Exposures Effectively with Saner CSAE
Saner Cloud offers a comprehensive toolset for managing an organization’s assets. The focus on Asset Exposure ensures that IT administrators have full visibility and control, which is crucial for maximizing resource utilization and ensuring compliance through automated audit reports. Additionally, users gain complete visibility of compliant and non-compliant resources across AWS, Azure, or GCP to prioritize them for remediation based on risk.
The CSAE dashboard provides a quick view into:
1. Service Distribution
2. Resources Distribution
3. Active Resources on Geo Locations
4. Resource Categorization
5. All Resources
6. Resource Type and Service Type Trends over time
7. Total Resources Trends over time
8. Cost and Usage Graph
9. Cost and Usage Breakdown
10. All Outdated Resources
11. Watch Listing Resources
Additionally, administrators can:
12. Run scans to update the dashboard with the current information
13. Take various actions from the view, such as sorting or filtering, searching for keywords, selecting the number of records to view, and exporting the records into a spreadsheet (CSV).
Salient Highlights
AI Assistant Integration
The summarization grid in the various dashboards enables the AI assistant to retrieve responses related to the relevant data.
By clicking the green icon within the summarization grid, the AI assistant dynamically fetches and displays the response in a tooltip within the dashboard.
Real-Time Insights
Provides live data updates after every scan for accurate decision-making on security and resource optimization.
Resource Proportion and Distribution
- Assess the proportion of each resource type in your cloud infrastructure.
- Track cloud assets and services across geographical regions to identify resource concentrations and assess their security posture based on location.
Resource Organization
Categorizes resources into various groups: Compute, Application Integration, Databases, Blockchain, Storage, Networking, Cloud Financial Management, etc.
Security and Resource Monitoring
- Visual indicators highlight “Publicly Accessible” resources with distinct color codes for active and inactive resources.
- Aids in identifying security risks related to public network interfaces.
Fluctuation and Vulnerability Insights
Track changes in service/resource distributions and monitor remediation efforts for vulnerabilities over time.
Cost and Usage Management
View aggregate costs incurred across services and months in specific environments.
Identification of Outdated Resources
Identify applications or systems relying on deprecated or unsupported versions.
Critical Resource Monitoring
Highlight resources requiring special attention due to higher risks or essential infrastructure roles.
Actionable Dashboard Features
Sort, filter, search for keywords, adjust record views, and export data into CSV files.
Explore the Dashboard Views
| Component | What it Conveys? |
|---|---|
| Service Distribution | The Service Distribution visualization helps assess cloud security posture by displaying the type of resources being used (e.g., virtual servers, instances, databases) and the number of services, categorized by their status (e.g., critical services, services with vulnerabilities, remediated services, and pending services). This visualization is presented as a clustered bar stack chart, combining “Resource Type” and “Number of Services” to offer insight into cloud resource usage and service status. The live data in the dashboard block is updated after every scan, ensuring the information is current and accurate for making decisions about security and resource optimization. Users can customize the stack chart visualization by selecting specific services or a combination of services through a drop-down in the dashboard block. Clicking on a specific service type opens the “Details” page, listing all the resources with the corresponding Resource ID, Resource Name, Resource Type, Profile Name, Region Name, and if Publicly Accessible. By following the Resource ID link, users can access additional details such as Cloud Account ID, Cloud Provider, Profile Name, Region Name, Resource Category, Service Type, and a detailed summary covering Reservations, Groups, Instances, and more. This visualization and linked data provide a comprehensive tool for monitoring cloud environments, ensuring informed security decisions and effective resource management. Visual indicators are used to monitor the status of the “Publicly Accessible” resources, indicating if these are properly flagged or monitored. Exposed resources are denoted in orange, while nonexposed resources are marked in grey. This setup helps in quickly identifying which instances are actively utilizing public network interfaces and which ones are not, aiding in security and resource management decisions. Additionally, users can take various actions from the view, such as sorting or filtering, searching for keywords, selecting the number of records to view, and exporting the records into a spreadsheet (CSV). |
| Resources Distribution | Resource Distribution Pie chart visually represents the distribution of active resources to help you quickly assess the proportion of each resource type within your cloud infrastructure. Active resources are distributed across the following categories: — Log Streams — Log Groups — Network interfaces — Rules — Security Groups — Stacks — Virtual private cloud (VPC) — DB cluster snapshots -— DB instances — Keys — Key pairs — Total Resources Additionally, users can take various actions in the dashboard block, such as: Applying filters to view specific resources and Exporting the records into a spreadsheet (CSV). The live data in the dashboard block is refreshed after every scan, ensuring that the information remains current and accurate for making decisions about security and resource optimization. |
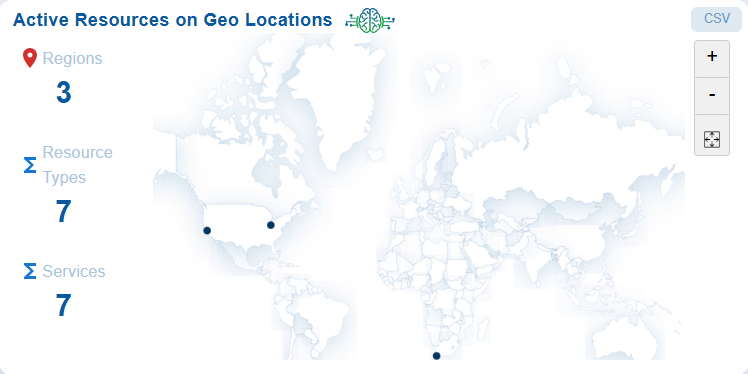
| Active Resources on Geo Locations | Active Resources by Geo-location shows active resources on a map, displaying country names, total resources, and total services. This visualization helps to track cloud assets and services across different geographical regions, allowing for the identification of resource concentration and assessment of their security posture based on location. When an instance is associated with a geographical location, it is bound to be used only in that region. During account creation for any cloud provider, default quotas are set on the resources on a per-region basis. By monitoring the usage, quotas are automatically raised within each region. |
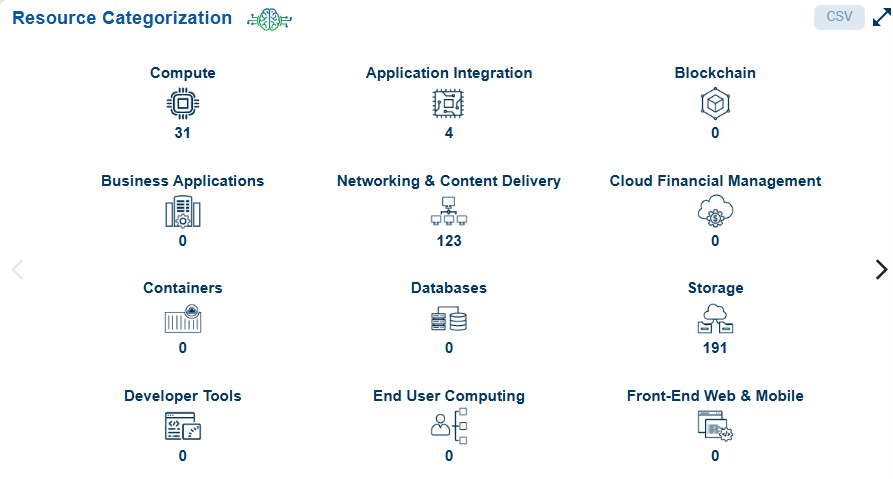
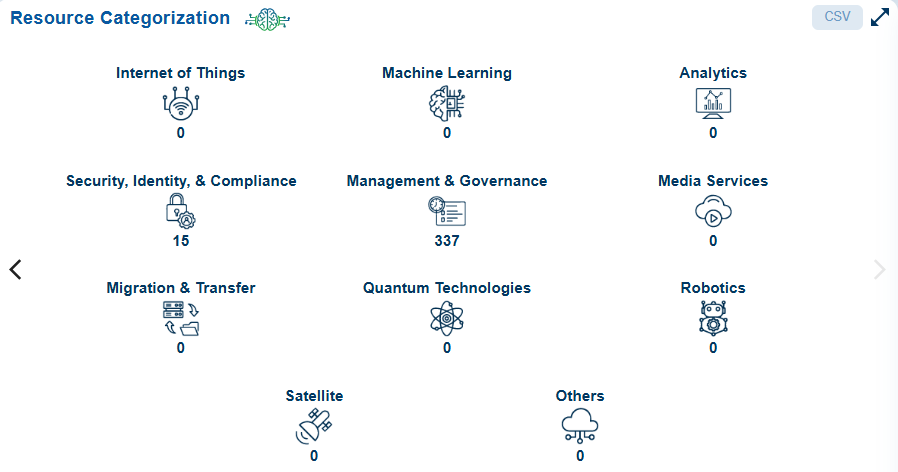
| Resource Categorization | Resource Categorization organizes resources into different categories such as Compute, Application Integration, Databases, Blockchain, Business Applications, Storage, Networking & Content Delivery, Cloud Financial Management, and more. When you click on a specific resource category, it opens the “Details” page, which lists all the resources along with their corresponding Resource ID, Resource Name, Resource Type, Service Name, Profile Name, Resource Type, and Resource Category. By following the Resource ID link, users can access additional details such as Cloud Account ID, Cloud Provider, Profile Name, Region Name, Resource Category, Service Type, and a detailed summary covering Reservations, Groups, Instances, and more. Users can also take additional actions from the dashboard block, such as exporting the records into a spreadsheet (CSV) or opening the detailed view of all resource categories using the bi-directional arrow. In the detailed view, users can specify the number of records to display on a page. Additionally, they can create a new Watchlist configuration for the resources. To do this, follow the Watchlist link and complete the following steps: — Provide the configuration name — Choose one or more cloud profiles from the multi-select drop-down — Choose one or more Service Types from the multi-select drop-down — Choose one or more Regions from the multi-select drop-down where the watchlist must apply — Determine the reason for watchlisting — Apply on the current dataset or next cloud scan — Finally, add to the watchlist configuration list The live data in the dashboard block is refreshed after every scan, ensuring that the information remains current and accurate for decision-making regarding security and resource optimization. |
| All Resources | A column view presents all the resources along with their Resource ID, Resource Name, Resource Type, Service Name, Profile Name, Resource Type, and Resource Category. By clicking on the Resource ID link, users can access additional details including Cloud Account ID, Cloud Provider, Profile Name, Region Name, Resource Category, Service Type, and a detailed summary covering Reservations, Groups, Instances, and more. Visual indicators are used to monitor the status of “Publicly Accessible” resources, with exposed resources displayed in orange and nonexposed resources in grey. This setup allows for quick identification of which instances are actively utilizing public network interfaces, aiding in security and resource management decisions. This visualization and linked data provide a comprehensive tool for monitoring cloud environments, ensuring informed security decisions and effective resource management. Users can take various actions from the view, such as sorting or filtering, searching for keywords, selecting the number of records to view, and exporting the records into a spreadsheet (CSV). |
| Resource Type and Services Type Trends over time | This graph is presented as a Stacked Area Chart and is designed to track Resource Types (such as Virtual Servers, Instances, Databases, etc.) and Service Types (Critical Services, Vulnerable Services, Remediated Services, Pending Services, etc.) over a 30day time period. This visualization can offer insights into: — Fluctuations in the distribution of services and resources. — If remediation efforts are keeping up with vulnerabilities over time. Each color in the stack represents a service type, allowing you to observe the total resources and their distribution in the specified days. The live data in the dashboard block is refreshed after every scan, ensuring that the information remains current and accurate for decision-making regarding security and resource optimization. Users have an additional capability to export the records into a spreadsheet(CSV). |
| Total Resources Trends over time | This graph is presented as a Stacked Area Chart and is designed to track the total number of resources across various Virtual Servers, Instances, Databases, etc. over a 30day time period. This visualization offers insights into: – Fluctuations in the distribution of resources. – If remediation efforts are keeping up with vulnerabilities over time. Users have an additional capability to export the records into a spreadsheet(CSV). |
| Cost and usage graph | The cost and usage graph is shown as a stacked bar chart, displaying the expenses for various cloud services each month in USD for a specific environment. Users also have an option to export the records into a CSV spreadsheet. |
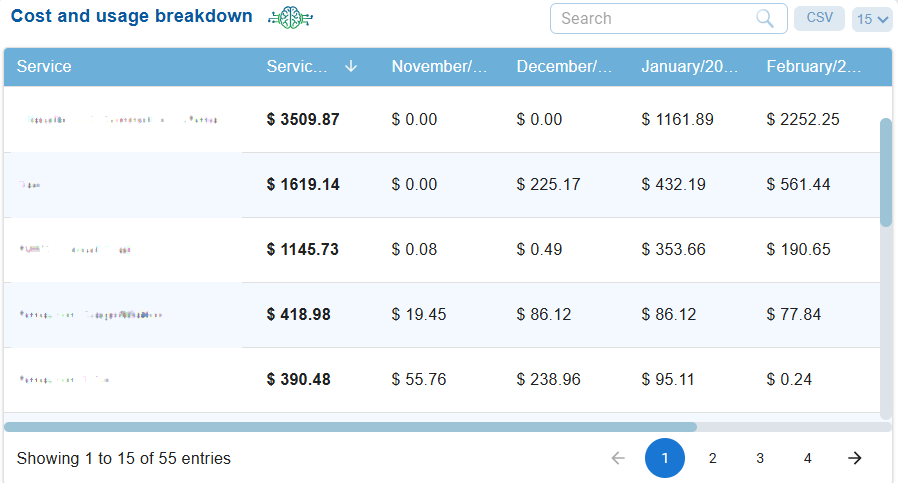
| Cost and usage breakdown | A column view presents the aggregate amount incurred over the different months across all the services in a specific environment(profile). Users can take various actions from the view, such as sorting or filtering, searching for keywords, selecting the number of records to view, and exporting the records into a spreadsheet (CSV). |
| All Outdated Resources | Applications or systems that depend on deprecated or unsupported versions are commonly known as “Outdated Resources.” If these resources are not maintained properly, they can expose the environment to serious security risks, compliance violations, operational downtime, and data breaches, among other issues. Saner Cloud offers guidance by executing automated vulnerability scans and displaying outdated resources on a user-friendly dashboard. This enables users to: a) Identify deprecated or unsupported resources b) Review and prioritize resources that are no longer in use or are vulnerable c) Remove unnecessary resources |
| Watch Listing Resources | Watchlist resources refer to specific cloud assets or services identified for closer monitoring due to their significance, potential vulnerabilities, or critical role in operations. These resources may require special attention because they could present a higher risk or are part of essential infrastructure that must be continuously monitored. Adding resources to a Watchlist enables proactive monitoring and ensures that any changes or risks associated with these critical resources are addressed promptly. |
Learn How To
Setup Watchlist Configuration for a Resource?
Overview
Adding resources to a Watchlist enables proactive monitoring and ensures that any changes or risks associated with these critical resources are addressed promptly.
Access Watchlists from Saner Cloud Security
Step 1: Launch Saner CSAE
After you login, select Cloud Security from the landing page. Next, click the App Launcher(on top of the page) and choose CSAE(Cloud Security Asset Exposure).
Step 2: Access Watchlists
Click the Watchlist link on the top-right of the page. The Watchlist Configuration details page opens. Go ahead and click the Create New Watchlist Configuration button to add resources to the watchlist.
Add Resources to the Watchlist
Step 1: Provide a name for the watchlist and choose the cloud profile, service type, and regions from the relevant drop-down menus
Step 2: Enter the reason for creating the watchlist
Step 3: Specify when you want the configuration to take effect by selecting “Current Dataset” or “Next Cloud Scan”
Step 4: Finally, click the “Add to watchlist” button to add your resources to the watchlist
Step 5: [Optional] If you want to start over, click the “Clear configuration” button to clear the fields
View the Configured Watchlists
The configured watchlists display in the Details view.
From the details view you have an option to only delete the watchlist. The system restricts editing a watchlist. You need to create a new watchlist incase you want to update a watchlist.
How to Identify Outdated Resources for Cleanup?
Overview
Utilizing deprecated or unsupported software components can pose security risks as you no longer receive security updates or patches. Saner Cloud offers guidance by executing automated vulnerability scans and displaying outdated resources on a user-friendly dashboard. This enables users to:
a) Identify deprecated or unsupported resources
b) Review and prioritize resources that are no longer in use or are vulnerable
c) Remove unnecessary resources
Step1: Launch Saner CSAE
After you login, select Cloud Security from the landing page. Next, click the App Launcher(on top of the page) and choose CSAE(Cloud Security Asset Exposure).
Step 2: Access the Outdated Resources
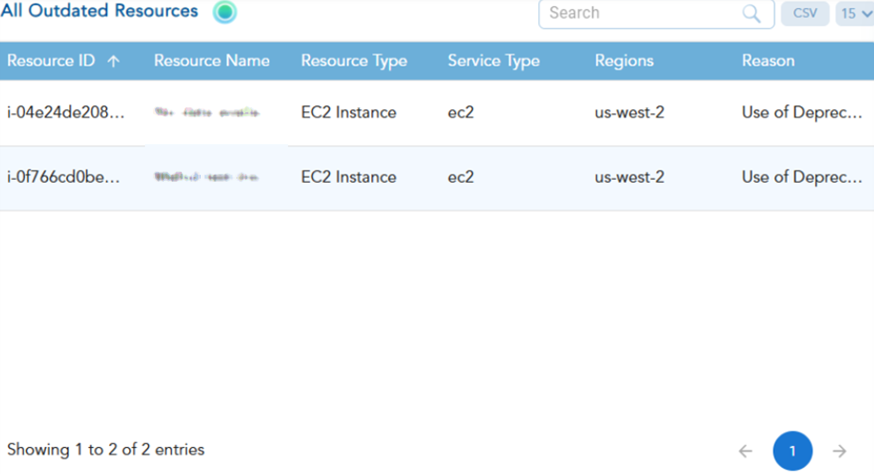
Access all the resources that are no longer in use within a region along-with the reason for marking as outdated from the CSAE dashboard. After scanning, Saner CSAE detects and presents the “All Outdated Resources” view, which includes the following information in a column format:
- Resource ID
- Resource Name
- Resource Type
- Service Type
- Region
- Reason
You can review the data to identify resources that are no longer in use and prioritize their cleanup to avoid exposing the environment to security risks.
View Resource Count by Cloud Account at the Organization-level
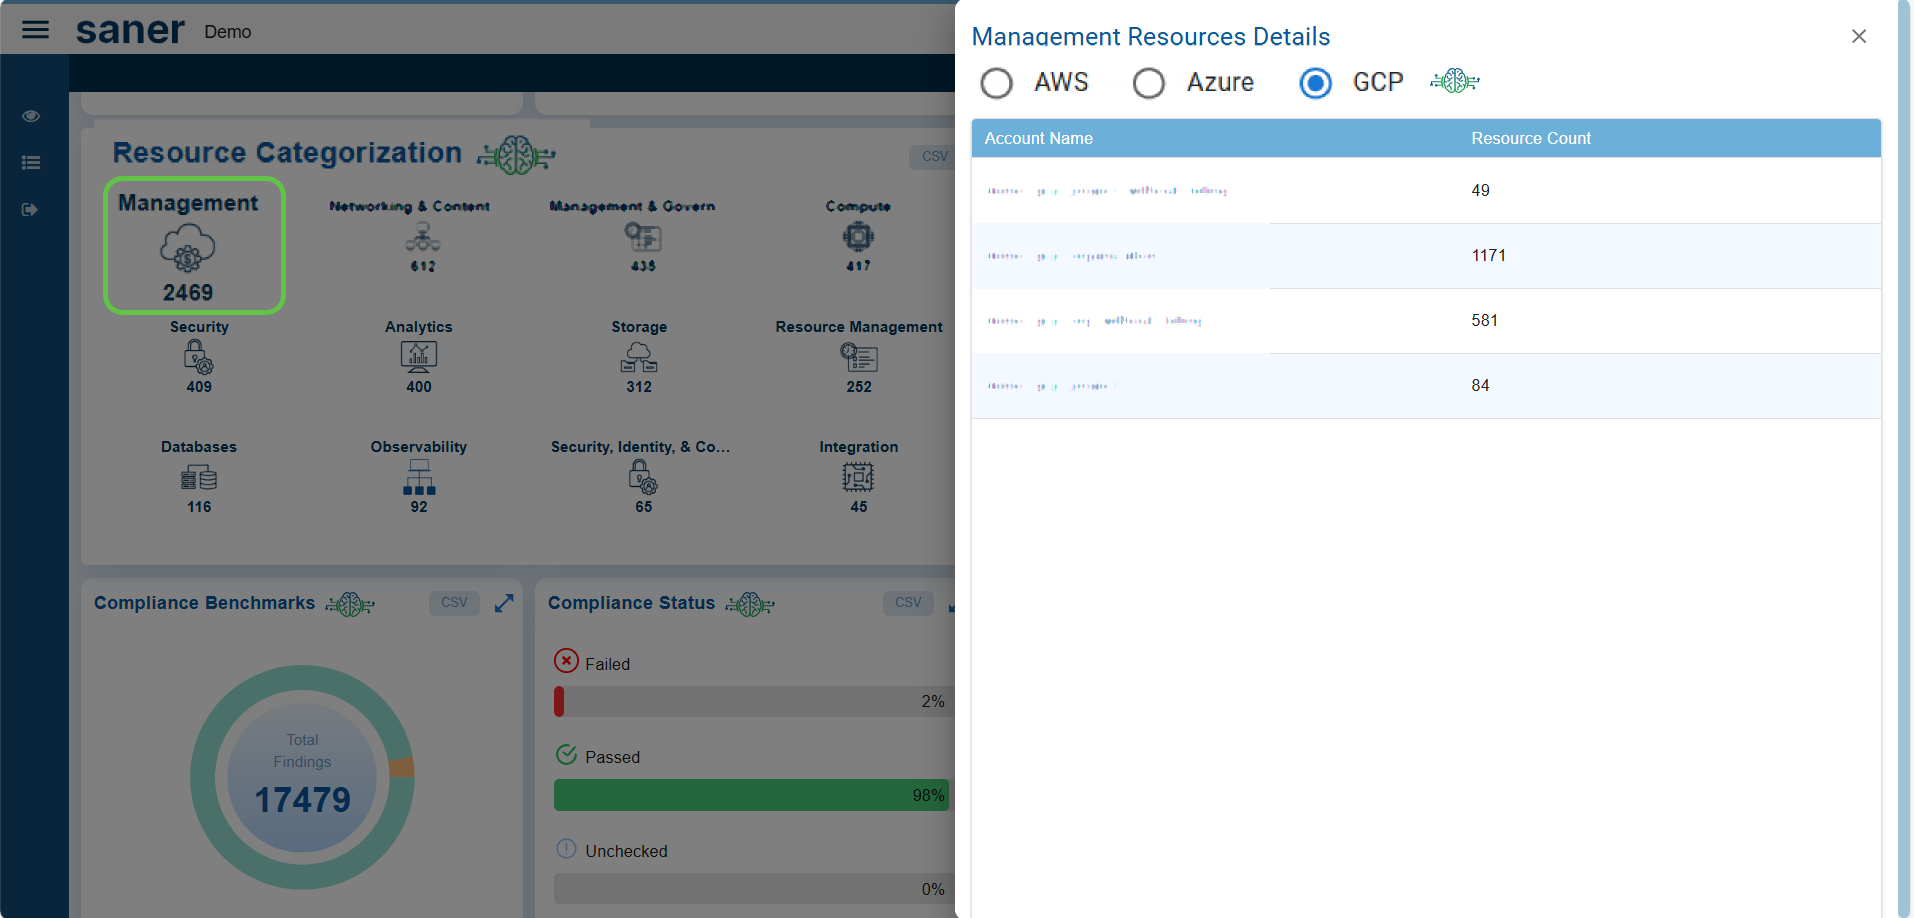
To view details at the organization level, click on any category in the Resource Categorization view. This opens the corresponding “Details” view, where you see the account names along with their respective resource counts. You can filter these details based on the selected cloud provider: AWS, Azure, or GCP.
How does Resource Categorization Work in Saner CSAE?
Overview
Resource categorization is essential for managing large cloud environments effectively. It enhances visibility, helps identify unused or outdated resources, ensures compliance with security standards and policies, and allows for detailed analysis to diagnose issues.
Saner CSAE organizes cloud resources into logical groups and offers guidance to analyze these resources to assess their relevance, configuration, and security posture. Resource categorization varies based on the cloud provider. The available resource categories and how resources are grouped can differ across AWS, Azure, and GCP.
Understand the Available Resource Categories
Resource categorization varies based on the cloud provider. The available resource categories and how resources are grouped can differ across AWS, Azure, and GCP.
Resource categories within Saner CSAE include:
| Resource Categories | What it Constitutes? |
|---|---|
| Compute | Virtual machines, containers, or serverless functions |
| Application Integration | Services like messaging queues, integration tools, and event-driven architectures (e.g., AWS SQS, SNS, Step Functions) |
| Blockchain | API calls and resource actions |
| Business Applications | ERP systems, CRM tools, financial platforms, eCommerce sites |
| Networking & Content Delivery | Network interfaces, load balancers, VPCs, and security groups. |
| Cloud Financial Management | Payment processing, transaction database management, resource cost optimization, data security compliance, and access management |
| Databases | Managed database services (e.g., AWS RDS, Azure SQL, GCP, BigQuery). |
| Storage | Object storage (e.g., AWS S3, Azure Blob) and block storage (e.g., EBS) |
| Developer Tools | Source code repositories, artifact storage security, pipeline IAM optimization, outdated developer environments, unused CI/CD resources |
| End User Computing | Virtual desktops, file storage, snapshots/backups, virtual applications |
| Front-end Web & Mobile | S3 Buckets / Storage, APIs, CDNs (CloudFront, etc.), Serverless Functions, CI/CD Pipelines, IAM Roles |
| Internet of Things | IoT Endpoints, Cloud Storage, APIs, Outdated Firmware, Serverless Functions, IAM Roles |
| Machine Learning | Storage buckets, Compute Instances, Model Endpoints, Pipelines, IAM Roles, Outdated Libraries |
| Analytics | Public Data Lake Exposure, Idle Redshift Clusters, Exposed Tableau Dashboards, Unsecured Data Pipelines, Excessive IAM Permissions |
| Security, Identity, & Compliance | IAM Roles & Policies, Security Groups, Public Resources, Encryption, Compliance, Inactive Accounts, Logs & Monitoring |
| Management and Governance | Logging services, alarms, IAM policies, and monitoring |
| Media Services | Media storage, CDNs, DRM and Encryption, Media APIs, Transcoding Jobs, Streaming Services |
| Migration & Transfer | Data transfer services, IAM Roles, Staging Buckets, Virtual Machines, Firewalls and Security Groups, Databases |
| Quantum Technologies | Quantum Workloads, Quantum Cryptography, Quantum APIs, Quantum Communication Channels, Orphaned Quantum Jobs, Hybrid Quantum-Classical Systems |
| Robotics | Control Systems, Sensor Data Storage, Fleet Management, Simulation Environments, APIs for Robotic Systems, AI/ML Models |
| Satellite | Satellite Control Systems, Satellite Data Storage, Ground Station Infrastructure, Real-time Data Streams, APIs for Satellite Operations, Orphaned Resources |
| Others | As applicable |
Drill-down on Specific Resource Category
Click on a specific resource category to open the detailed page that lists all the resources along with their corresponding details.
| Resource Details | Description |
|---|---|
| Resource ID | Unique identifier for the resource (for example, arn for AWS, Azure, or GCP resources) |
| Resource Name | Name of the cloud resource |
| Service Name | Name of the cloud service (e.g., EC2, S3, and so on) |
| Resource Type | Specifies the kind of resource (e.g., Network Interface, Log Stream, and so on) |
| Resource Category | Group to which the resource belongs |
The live data in the page refreshes after every scan, ensuring that the information remains current and accurate for decision-making regarding security and resource optimization.
Drill-down into Individual Resources for Analysis
By following the Resource ID link, users can access additional details and Summary for further analysis.
| Additional Resource Details | Description |
|---|---|
| Cloud Account ID | The Id assigned to a cloud account within an organization |
| Cloud Provider | Specifies the platform (AWS, Azure, and GCP) |
| Region Name | Geographical location of the resource (e.g., us-west-2, us-east-1) |
| Resource Category | Group to which the resource belongs to. For example, Networking and Content Delivery |
| Service Type | Category of resources. Common service types include: Infrastructure Services: Servers, storage, networks (e.g., AWS EC2, Azure VM) Platform Services: Databases, middleware, runtime environments (e.g., AWS) Application Services: Web apps, APIs, email services (e.g., Office 365, SAP) Security Services: Firewalls, intrusion detection, encryption tools (e.g., Palo Alto, Fortinet) |
| Summary | Users can do a detailed analysis with extended information |
Switch Between Standard and Json Views
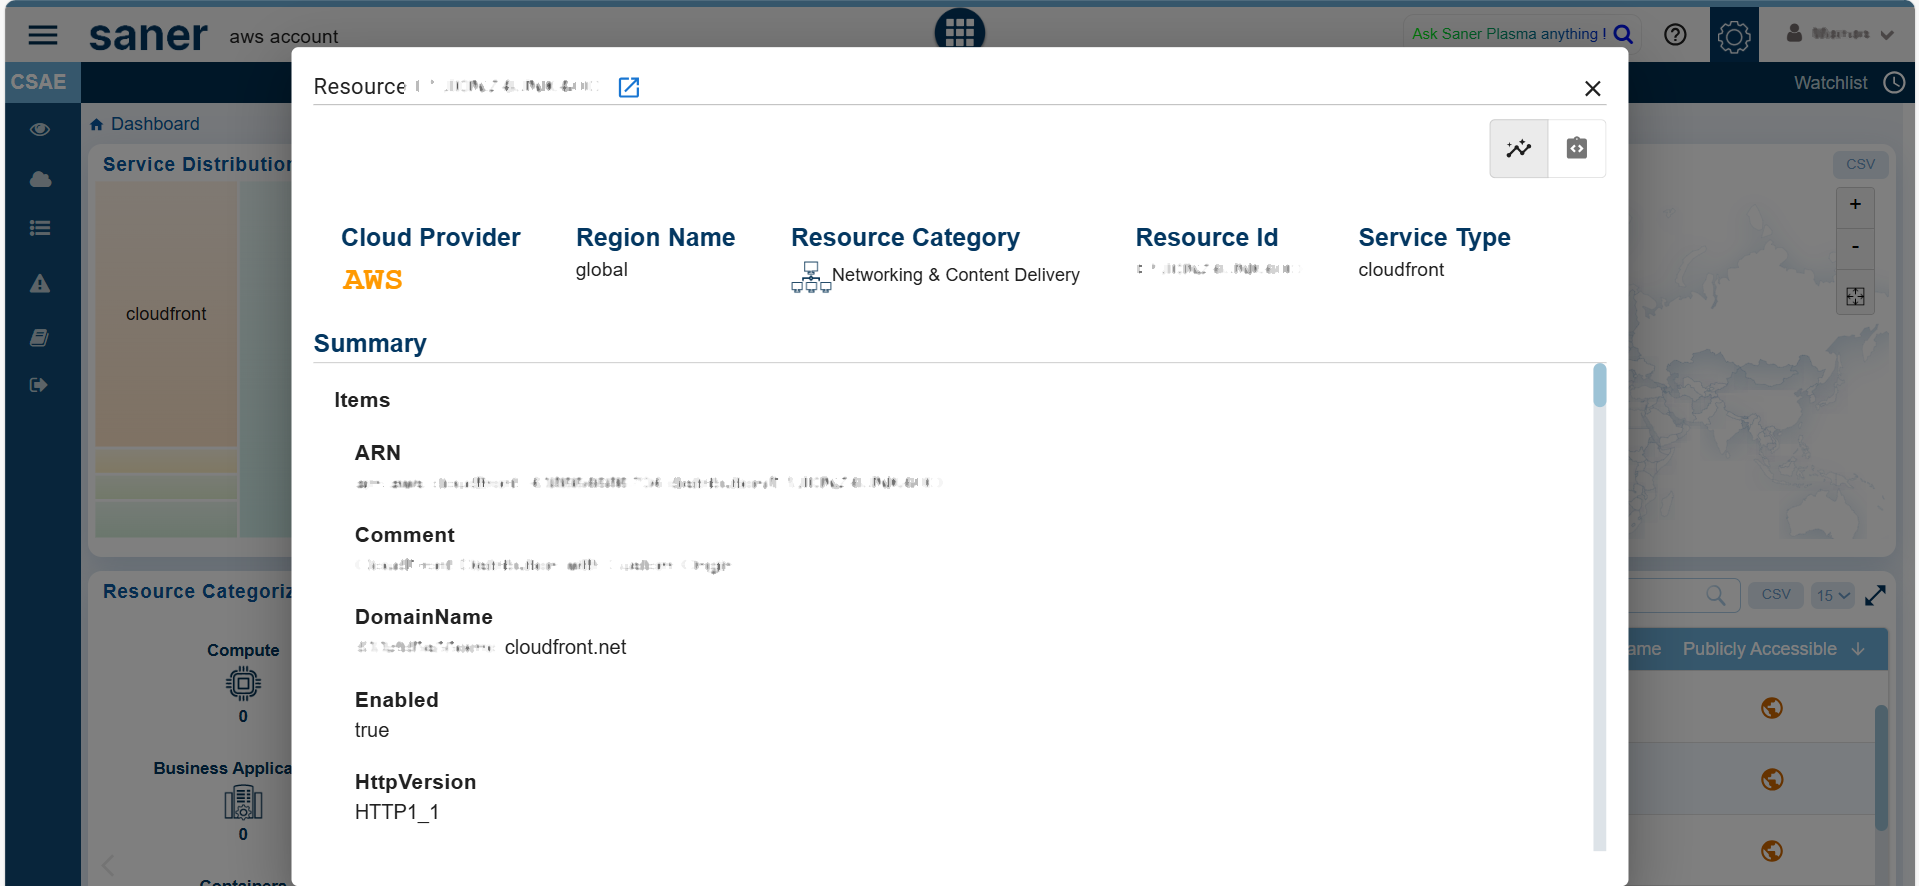
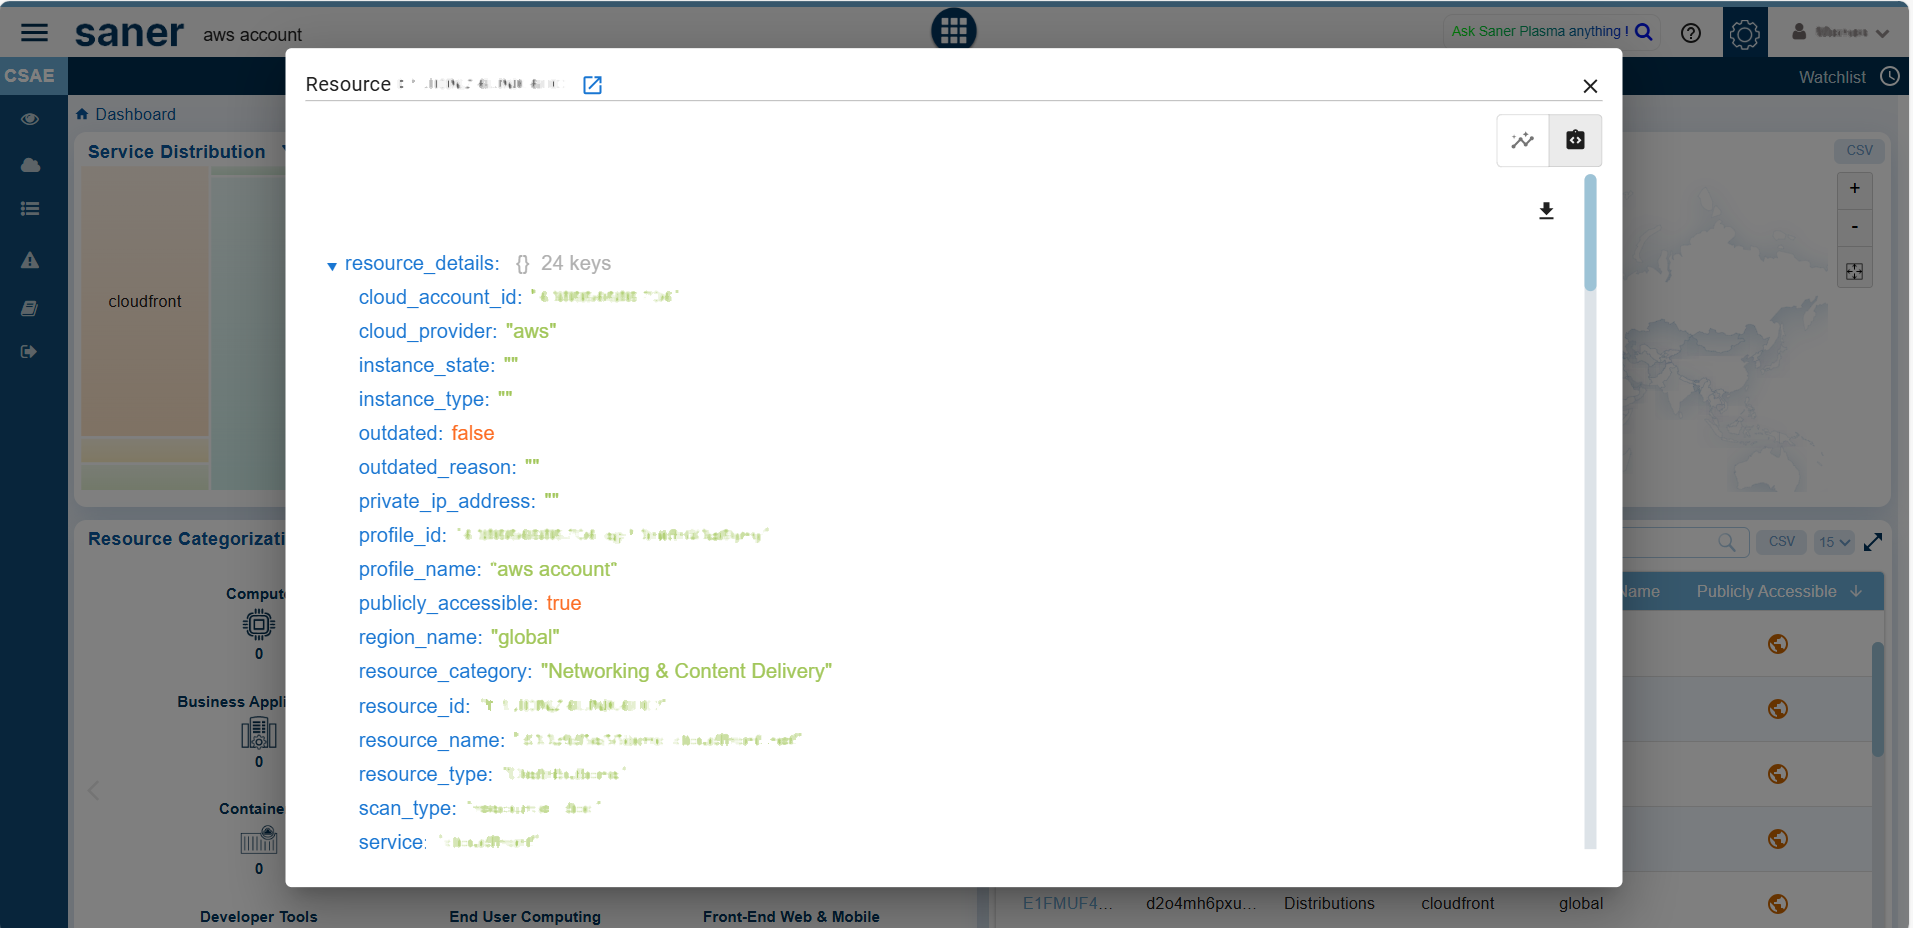
Within a specific Resource, you have an option to toggle between the Standard and Json views by clicking the appropriate buttons within the individual resources details view.
Search and Access Categories
From the “Resources by Category” section under the Categorization tab, use the search bar to quickly locate specific resources or categories based on keywords. Just key in your search criteria, expand the desired category to view its resources, and drill-down into individual resources to analyse the security posture, usage, or outdated components.
Perform More Actions
Users can also take additional actions from the dashboard block, such as exporting the records into a spreadsheet (CSV) or using the bi-directional arrow to open the sub-categories pertaining to the resource.
In the detailed view, users also have an option to specify the number of records to display on a page.
How to Understand the Resource Footprint Globally Across Various Regions
Overview
Active Resources by Geo-location shows active resources on a map, displaying country names, total resources, and total services. This visualization helps to track cloud assets and services across different geographical regions, allowing for the identification of resource concentration and assessment of their security posture based on location.
When an instance is associated with a geographical location, it is bound to be used only in that region. During account creation for a cloud provider, default quotas are set on the resources on a per-region basis. By monitoring the usage, quotas are automatically raised within each region.
Access the Active Resources on GeoLocations
Step 1: Launch Saner CSAE
Step 2: Go straight to the “Active Resources on Geo-location” block on the dashboard.
Track cloud assets and services across different geographical regions; additionally identify the resource concentration and assessment of their security posture based on location.
How to Identify Resources Exposed to External Network?
Overview
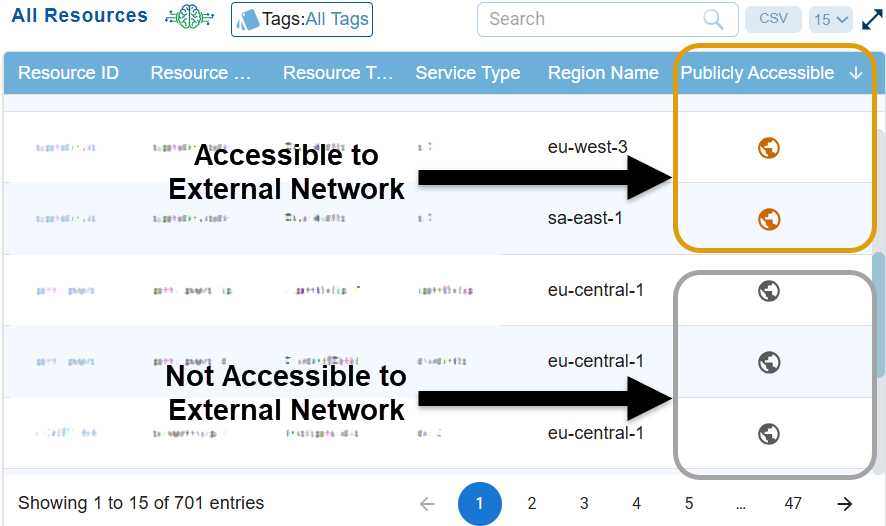
You can quickly identify which resources are actively utilizing the public network interfaces and which ones are not, aiding in security and resource management decisions. These resources can include databases, storage buckets, or compute instances.
Identify the Publicly Accessible Resources
Step 1: Launch Saner CSAE
Step 2: Go straight to the “All Resources” block on the dashboard
Step3: Look into the “Publicly Accessible” column.
Observe the resources that need attention are flagged in orange, and those that comply with specifications are in grey making it easy for identification.
Step3: Click on the resources highlighted in orange to learn more about why they are marked as public. You can switch between the Standard and JSON views by clicking the corresponding buttons in the individual resource details view.
How to Make Informed Decisions on Your Expenditure based on Cost and Usage Graph?
Overview
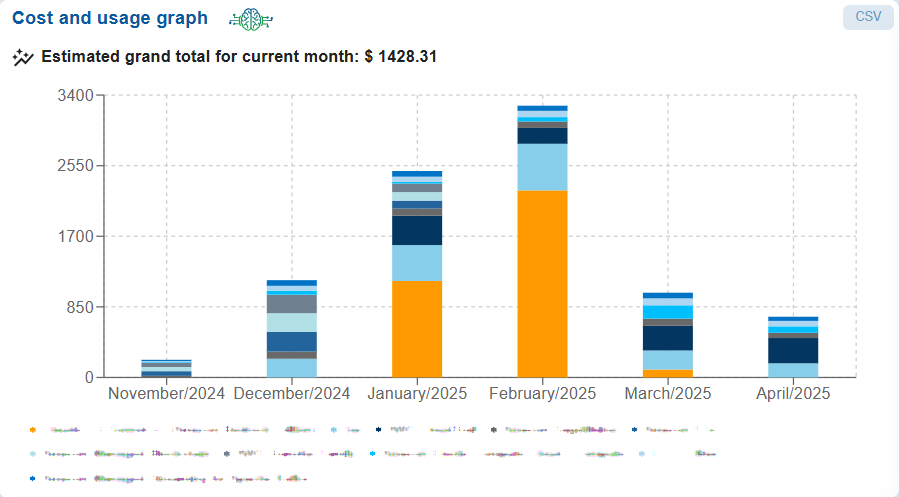
The Cost and Usage Chart and Breakdown Summary on the Saner Cloud dashboard for AWS, Azure, or GCP play a vital role in financial governance, cloud optimization, and resource management. These views empower cloud users to make informed decisions, enhance cost efficiency, and strengthen their cloud financial operations.
The Cost and Usage graph presents a monthly stacked bar chart that illustrates service-wise expenditures over several months, with an estimated grand total for the current month clearly displayed and the Breakdown summary displays service-wise expenditures over several months.
The views offer insights into the usage and consumption of services in either AWS, Azure, or GCP providing a detailed breakdown of your cloud expenses. Each line item outlines the costs associated with every AWS, Azure, or GCP service, along with the expenses incurred for each service across different months.
Analyze Your Expenditure
From the chart and breakdown summary views, you can analyze several key aspects of costs for a particular month. This includes identifying the month with the highest expenditures, months with lower spending, and the tax amount as a proportion of the total cost across various services. You may also observe trends such as minimal usage in certain months, noticeable spikes or diversified use of services in specific months, and sharp increases driven by certain services that may have distinct cost components. By conducting this analysis, you can develop a cost optimization recommendation plan.
Step 1: Launch Saner CSAE
Step 2: Go straight to the “Cost and Usage” block that displays the chart and breakdown summary views on the dashboard
Step 3: Proceed with your analysis directly from the dashboard. Alternatively, click the CSV button to export the data into the spreadsheet for further analysis.
Commonly Asked Questions
How does Saner Cloud help me track resource usage?
The system allows users to track resource usage per region and automatically adjusts quotas based on usage. During AWS account creation, default quotas are set on the resources on a per-region basis. By monitoring the usage, quotas are automatically raised within each region.
I want to know how flexible is the CSAE dashboard in terms of customizing the data I see?
Users can customize the stack chart visualizations by selecting a single service or a combination of services from the drop-down menu to create tailored views. This customization helps in focusing on specific resources or services that require more attention.
Additionally, you can also apply customizations to:
• Filter by specific resource types (e.g., Virtual Servers, Databases)
• Visualize resources on a map, broken down by regions or countries
I need to prioritize security actions for my critical assets and services. Which components in the CSAE dashboard helps me do this?
The CSAE dashboard includes Service weightage metrics such as Resource Type and Number of Services, allowing users to quickly identify critical services and those with known vulnerabilities. This helps in prioritizing security actions for high-risk assets.
I want to avoid unnecessary exposure from resources exposed to public network. Is there a way to identify these publicly accessible cloud resources?
You can utilize the CSAE dashboard to identify which resources are truly accessible from the external network. Resources that need attention are flagged with green, and those that comply with specifications are in red making it easy to identify which instances are actively using public network interfaces.
I want to have a quick view of resources that are obsolete. Where can I find it in Saner CSAE?
Access all the Outdated resources within a region along-with the reason for marking as outdated from the CSAE dashboard.
I want to do an in-depth analysis of specific types of resources. How does Saner CSAE fulfil this need?
CSAE categorizes resources into groups like Compute, Databases, Networking, etc. Clicking on a resource category opens a detailed page that includes information such as Resource ID, Service Name, Cloud Provider, Profile Name, and more.
For specific analysis, users can drill down into each resource for a detailed summary, which includes reservations, groups, and instances.
I want to closely monitor my high-value/high-usage critical assets/services and quickly address any risks or changes associated to these. Is there a way to do it in Saner CSAE?
The Watchlist Dashboard allows users to monitor the resources in the watchlist and set tighter security controls for the assets on the watchlist. For instance, additional monitoring rules or access restrictions can be implemented to ensure that these critical assets have the highest level of protection.
I want to make informed decisions on my expenditure based on complete and current information or resource usage in the last 3months. How does Saner CSAE enable me to do this?
You can directly view the breakdown of resource usage across different months from the “Cost and Usage” dashboard block.
Alternatively, from the CSV spreadsheet, you can select the values for the preferred resources and months to analyse the total expenditure.
I’d like to gain visibility of all resources from a single source. How can I do that from Saner CSAE?
Review the detailed configuration (such as network interfaces, security groups, and virtual private clouds) via the resource details page.
A column view presents all the resources along with their Resource ID, Resource Name, Resource Type, Service Name, Profile Name, Resource Type, and Resource Category. By clicking on the Resource ID link, users can access additional details including Cloud Account ID, Cloud Provider, Profile Name, Region Name, Resource Category, Service Type, and a detailed summary covering Reservations, Groups, Instances, and more.
Just click on the specific country or region on the Geo-location map to get a quick summary or detailed information about the resources and services deployed there..
I want to know how Saner CSAE can address resource optimization to eliminate waste and redundancy?
• The centralized view of active resources across geo-locations provides a clearer overall security posture without redundant entries
• Resource categorization (e.g., Compute, Databases, Networking) removes confusion or redundancy
• Active/Non-active flags(Green/Red) aids in removing redundant resources no longer in use
I want to identify deviations or anomalies in resource usage patterns over time. How does SanerCSAE help me do this?
From the Resource and Service Type Trends Chart on the CSAE dashboard, detect and analyze resource and usage patterns over time. This visualization helps you identify unusual fluctuations in the distribution of services and resources affecting cloud assets
I ‘d like understand the resource and service footprint globally across various regions? How is this possible from Saner CSAE?
You can gain geographical insights into cloud resources or services across various geo-locations.
Active Resources by Geo-location shows active resources on a map, displaying country names, total resources, and total services. This visualization helps to track cloud assets and services across different geographical regions, allowing for the identification of resource concentration and assessment of their security posture based on location.
When an instance is associated with a geographical location, it is bound to be used only in that region. During AWS account creation, default quotas are set on the resources on a per-region basis. By monitoring the usage, quotas are automatically raised within each region.
How often is the CSAE dashboard updated?
Data in the dashboard is automatically updated each time the scheduled scan runs. If you want to start a scan on-demand, then turn on the scan to see the latest data in your dashboard view.
Does the product automatically categorize resources on Cloud? Can I create my own category of services?
Using watchlists, one can mark resource type/service type/specific resource to monitor. On the other hand, using the tagging feature helps categorize, identify or provide a filtered view of your resources across the product.

