Measure Cloud Security Posture and Compliance Position with Saner CSPM
The Saner Cloud Security Posture Management (CSPM) dashboard offers an interactive, real-time overview of your cloud environment’s security posture and compliance with frameworks such as NIST, HIPAA, SecPod Default, CIS, and PCI DSS.
The dashboard features various blocks that categorize findings as follows:
- Cloud Provider: Includes AWS, Azure, and GCP
- Severity: Ranges from High, Medium, to Low
- Publicly Accessible Resources: Identifies resources exposed to the external network
- Services: Evaluates specific cloud services
- Status: Indicates findings as Passed, Failed, or Unchecked
- GeoMaps: Provides a geographic representation of findings
- Trends: Monitors changes in security performance over time
The Trend Analysis feature highlights patterns in your security posture, while the SecPod Default Benchmark offers a ready-to-use compliance framework to streamline risk assessment and mitigation across your cloud assets. You can sort, filter, search, and customize the records displayed, as well as export data in CSV format for further analysis.
Salient Highlights
Interactive Real-Time Security Overview
Offers a live view of your cloud environment’s security posture and compliance with frameworks like NIST, HIPAA, CIS, SecPod Default, and PCI DSS.
Resource Evaluation and Risk Identification
Displays the number of resources evaluated and associated configuration risks identified during recent scans forAWS, Azure, or GCP.
Severity-Based Prioritization
Categorizes issues into High, Medium, and Low severity, helping you prioritize remediation efforts effectively.
Publicly Accessible Resources
Identifies resources exposed to external networks to aid in securing publicly accessible assets.
Geographic Security Insights
Provides a visual representation of security findings across geographic locations using an interactive map.
Trend Analysis
Tracks recurring, seasonal spikes, or reductions in affected resources as a result of implemented security measures.
Predefined Compliance Framework
Includes the SecPod Default Benchmark, a ready-to-use compliance framework to simplify risk assessment and mitigation across cloud assets.
Customizable Data Interaction
- Enables sorting, filtering, searching, and customization of displayed records.
- Supports exporting data in CSV format for further analysis.
Explore the Dashboard Views
| Component | What it Conveys? |
|---|---|
| Top 5 Affected Regions | The chart provides information about the number of resources evaluated and any associated configuration risks identified in the recent scan of various cloud services, including AWS Azure, or GCP. The dashboard block displays live data that is updated after each scan, ensuring that the information remains current and accurate for informed decision-making based on the latest findings. |
| Findings based on Severity | The pie chart categorizes findings by severity levels with “Critical” representing immediate threats to security or compliance. These findings may include issues like exposed sensitive data, unrestricted network access, and critical compliance failures. Only the latest “Failed” findings with “Critical” severity displays in the dashboard block after each scan. |
| Issues on Public Resources | Utilize the pie chart to Identify the resources exploitable by external network. You can click on the pie and get a detailed breakdown of the resources. ID: Unique identifier assigned to individual cloud security findings and indicates the tool(CSPM), the cloud provider(AWS, Azure, or GCP), the year the rule was defined, and a sequential finding number. These identifiers help you quickly reference, sort, and distinguish findings across different regions or resources Title: A brief explanation of the security issue Benchmark: The compliance(Regional, Global, or Both) to which the is assigned to benchmark during configuration Benchmark Rule: Security check that evaluates specific configurations or behaviors, determines compliance, and provides guidance for remediation. Rule Type: The rule type applied to the benchmark. Manual rules require human intervention to verify compliance. For example, checking physical security policies or manually reviewing rules. On the other hand, Automated rules or security checks do not require any additional configurations, manual inputs, or user intervention. For example, checking if disk encryption is enabled via automated scans. Region: One or more regions impacted by the cloud service Number of Affected Resources: The count of resources impacted by each finding Resource Count: The number of resources impacted by each finding Services Type: The specific cloud service (e.g., CloudFormation, CloudFront, CloudTrail, ConfigService) Resources Type: The type of resources affected (e.g., Stack, Distribution, Trail, ConfigurationRecorders) Severity: In Cloud Security Posture Management (CSPM), severity indicates the impact or criticality of a detected risk, misconfiguration, or vulnerability. This helps teams prioritize remediation efforts based on urgency. Severity levels typically include Critical, indicating the most serious issues requiring immediate action; High, covering major risks that needs resolution promptly; Medium, representing moderate-impact concerns; Low, for minor issues with limited risk. Fix displayed by a wrench icon to carry out the Remediation tasks for the selected security finding id. Note that the “Fix” option turns on only for “Failed” findings. Additionally, you can take various actions from the details view, such as sorting or filtering, searching for keywords, selecting the number of records to view, and exporting the records into a spreadsheet (CSV). |
| Findings based on Services | Presents a streamlined view of security findings (issues) across the selected cloud service. This enables you to prioritize remediation efforts based on the severity of issues and the number of affected resources. Based on your selection of “Failed,” “Passed,” or “Unchecked,” the relevant information displays in the following columns: – Unique Identifier: A distinct ID for each finding. – Title: A brief explanation of the security issue. – Benchmark: Benchmark applied to the resource – Benchmark Rule: Default identifiers for SecPod Default Benchmark – Rule Type: Each rule is categorized as either Manual or Automated, based on its compliance verification method. Manual Rules require human intervention to ensure compliance. For instance, this may involve checking physical security policies or conducting a manual review of specific rules. Automated Rules can be verified programmatically through scripts or security tools. An example of this is checking whether disk encryption is enabled using automated scans. – Region: The region of the cloud service impacted. – Resources Count: The count of resources impacted by each finding. – Services Type: The specific cloud service (e.g., CloudFormation, CloudFront, CloudTrail, ConfigService). – Resources Type: The type of resources affected (e.g., Stack, Distribution, Trail, ConfigurationRecorders). – Severity: For items marked as “Critical.” – Fix: Indicated by an “wrench” icon. Clicking the wrench(fix)icon navigates you to complete remediation tasks. You can filter the dashboard to focus specifically on “Critical” findings, allowing IT teams to address the most pressing issues and streamline their responses. This interface also allows you to view configuration names, regions, and provides options for evidence and remediation actions directly from the dashboard. Only “Failed” findings with a “Critical” severity level are displayed in the list. For each Failed “Critical” finding, you can follow a link to view a detailed breakdown that includes: – Title of the Finding: The name given to the finding. – Severity: Severity in Benchmark rules indicate the level of risk or potential impact associated with each security configuration issue. It helps prioritize issues based on their criticality to system security. The levels include: Critical, High, Medium, and Low. |
| All Primary Benchmarks | From the “All Primary Benchmarks” block in the dashboard, take a look at: All Benchmark Configurations used to evaluate system security. This helps in tracking compliance across multiple resources. Benchmark Details that displays the Configuration Name, Description, and Benchmark Name (e.g., SecPod_Default), indicating which standards are applied (like CIS, NIST, etc.) Severity Assessment that indicates the risk level(Not Evaluated, Critical, High, Medium, Low) of identified vulnerabilities in different color codes. |
| Geo-map | Provides a visual representation of security findings across various geographic locations on the map. Findings are color coded to help make high-risk locations immediately visible. For regional insights, you can click on the marker(represented as a dot) in a specific country or region and get a breakdown all the findings. Based on selection of “Failed,” “Passed,” or “Unchecked,” the relevant information displays in the following columns: – Unique Identifier: A distinct ID for each finding. – Title: A brief explanation of the security issue. – Benchmark: Benchmark applied to the resource – Region: The region of the cloud service impacted. – Resources Count: The count of resources impacted by each finding. – Services Type: The specific cloud service (e.g., CloudFormation, CloudFront, CloudTrail, ConfigService). – Resources Type: The type of resources affected (e.g., Stack, Distribution, Trail, ConfigurationRecorders). – Severity: For items marked as “Critical.” – Fix: Indicated by an “wrench” icon. Clicking the wrench(fix)icon navigates you to complete remediation tasks. Additionally, you can take various actions from the details view, such as sorting or filtering, searching for keywords, selecting the number of records to view, and exporting the records into a spreadsheet (CSV). |
| Date-wise Affected Resources Trend | Graphical depiction providing insight into the count of affected resources or cloud services(like AWS, Azure, or GCP) over a period of time, helping you track patterns and potentially anticipate future issues. This is useful for identifying recurring vulnerabilities, seasonal spikes, or reductions in affected resources due to implemented security measures. |
Learn How To
How to View the Compliance Severity Across Cloud Providers at Organization-level?
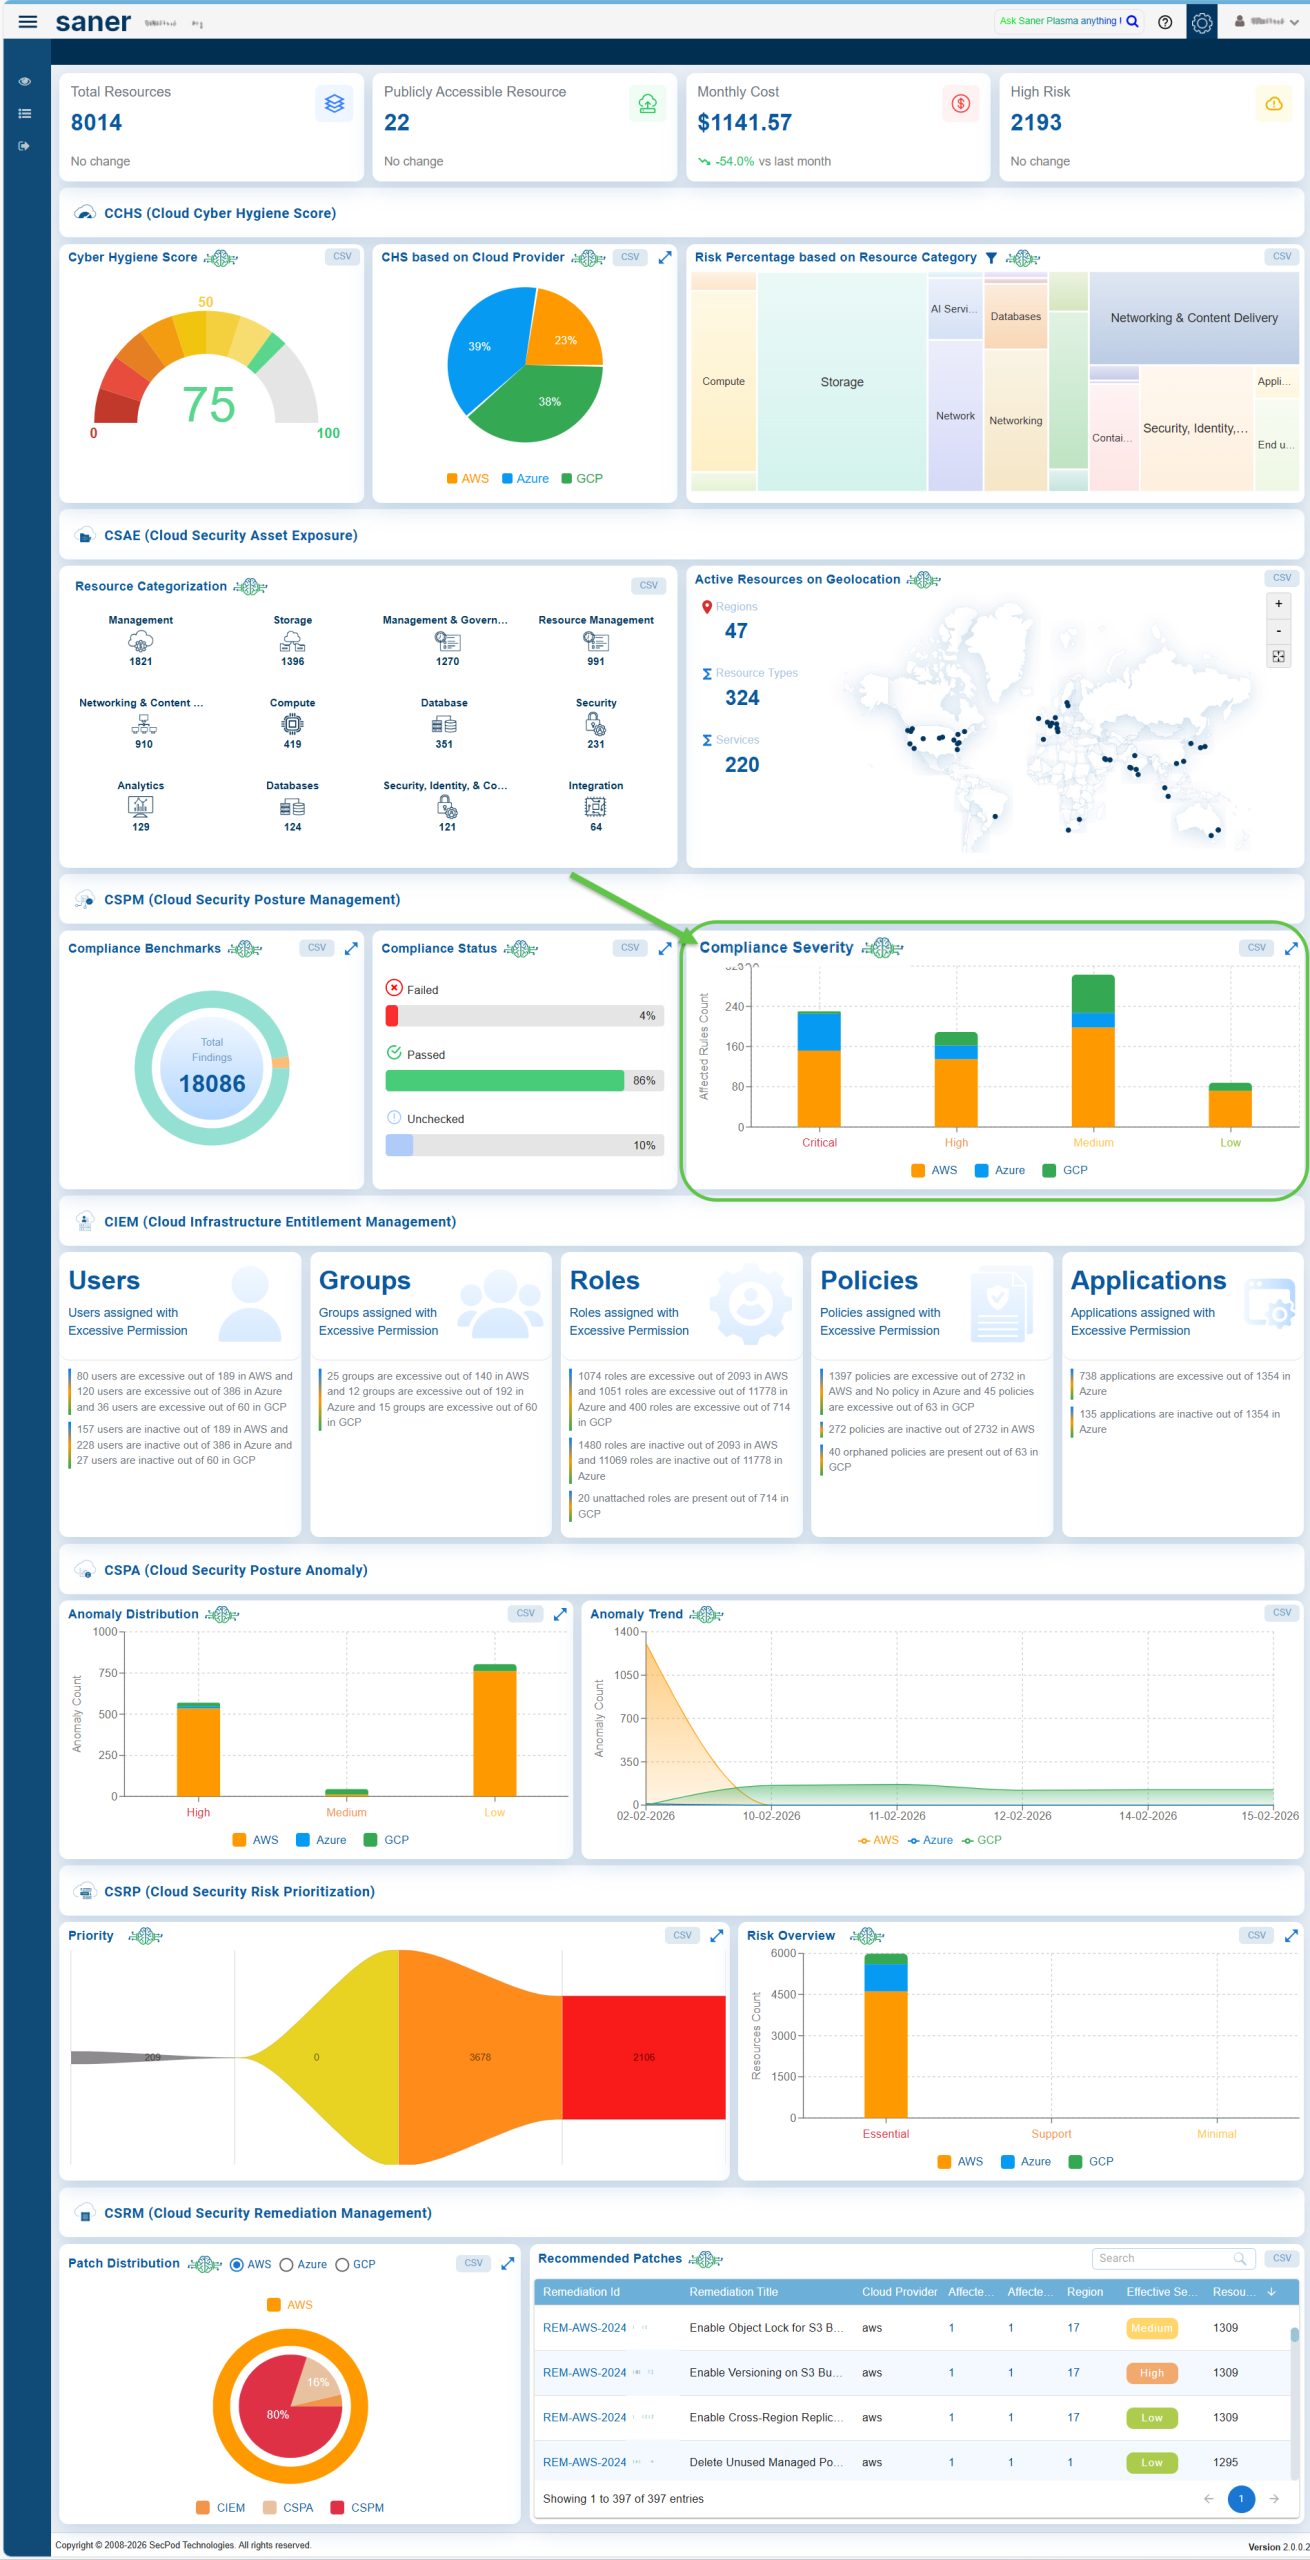
From the Organization-level Dashboard, you can view the compliance severity across the different cloud providers(AWS, Azure, or GCP). The bar stack chart format provides a clear visual representation of findings by severity levels with “Critical” representing immediate threats to security or compliance. These findings may include issues like exposed sensitive data, unrestricted network access, and critical compliance failures.
Steps to View Anomaly Distribution:
Step 1: Navigate to the Organization-Level Dashboard.
Step 2: Go stratight to the Anomaly Distribution view.
Step 3: Examine the chart to understand how the severity levels (Critical, Medium, High, and Low) are distributed across different cloud providers: AWS, Azure, and GCP.
How to Setup Benchmarks in Saner CSPM?
Benchmark settings are configurations designed to evaluate system security and compliance with predefined standards. They specify the types of rules, the rules affected, the values that are checked, and the severity levels used to categorize risks. Saner Cloud provides a variety of security benchmarks, including the built-in SecPod Default Benchmark.
The SecPod Default Benchmark offers a pre-configured, regulatory-compliant assessment framework designed to streamline risk identification and mitigation across cloud environments. Built with industry best practices in mind, this benchmark includes standardized rules that evaluate specific resource configurations, displaying compliance results directly on the dashboard for enhanced visibility and accessibility.
Access Benchmarks from Saner Cloud Security
Step 1: Launch Saner CSPM
After you login, select Cloud Security from the landing page. Next, click the App Launcher( on top of the page) and choose CSPM(Cloud Security Posture Management).
Step 2: Access Benchmarks
Click the Benchmarks link on the top-right of the page. The Configuration details page opens. Go ahead and click the Create New Benchmark button to launch the Wizard-based UI.
Setup a Benchmark Using Wizard-based UI
With the guided User Interface, go ahead and create a custom benchmark if predefined benchmarks don’t fit all your needs.
Step 1: Specify Security Benchmark to Use, Compliance Type, and Region to Apply
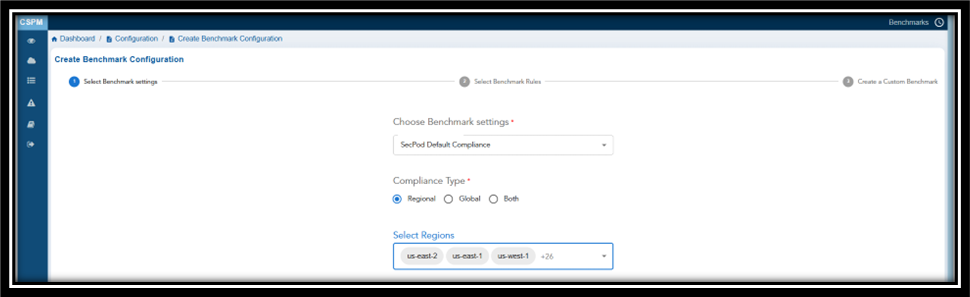
In this step, select the security benchmark that you want to use from the drop-down menu.
Available options:
- CIS Amazon Web Services Foundations Benchmark v3.0.0
- SecPod Default Benchmark
- NIST SP 800-53 Rev. 5
- PCI DSS v3.2.1
- HIPAA
- SOC
Additionally, specify the cloud region for which you want to apply the benchmark to from the drop-down menu.
Note: If you do not select the region, then the benchmark applies to all regions by default.
Define Benchmark Rules for a Compliance Type
| If You Choose… | Then |
|---|---|
| Regional | Region drop-down list appears, allowing you to select specific regions |
| Global | The benchmark is applied to all regions by default |
| Both | You can apply the benchmark to both specific regions and globally |
Additionally, specify the cloud region for which you want to apply the benchmark to from the drop-down menu.
Note: If you do not select the region, then the benchmark applies to all regions by default.
Tabular Listing of Benchmarks and Rules
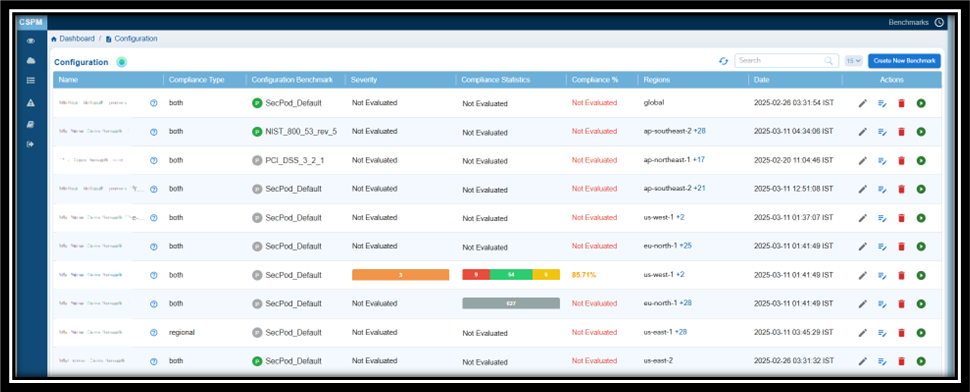
Click Next to see the Tabular listing of the Benchmarks with details on:
- ID
- Compliance Type
- Configuration Benchmark
- Severity
- Compliance Statistics
- Compliance%
- Regions
- Date
- Actions
From the tabular listing, you have an option to:
- Select Benchmarks for which you want create rules. Click Next and begin to select rules that align with the security standard
- See the Rule Type — Manual or Automated — applied to the Benchmark
- Update the Severity of Benchmarks. Click the Edit button under the Severity column and set the severity level.
- Get a quick glance of the benchmark details by clicking the Ask anything icon(displayed as a circled question mark) next to each Benchmark
See the Rule Type Applied to the Benchmark
Manual Rules require human intervention to verify compliance. For example, checking physical security policies or manually reviewing rules.
Automated Rules can be verified programmatically using scripts or security tools. For example, checking if disk encryption is enabled via automated scans.
Adjust the Benchmark Values As You Wish
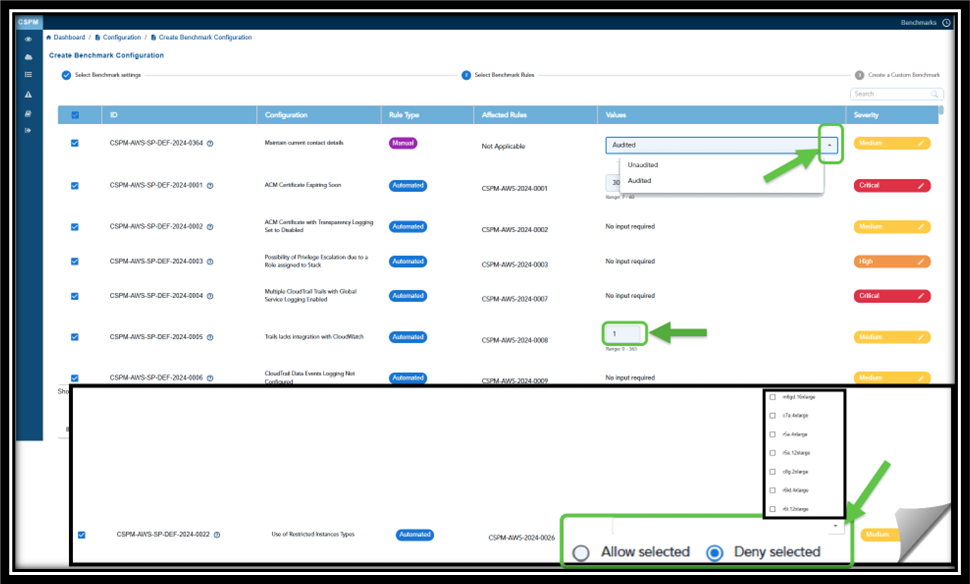
In the context of Saner Cloud Security Posture Management (CSPM), the term “No Input Required” refers to “Automated” security checks that do not require any additional configurations, manual inputs, or user intervention.
Saner CSPM automatically indicates whether a rule necessitates user input for customization or functions with default settings (“No input required”). However, users have an option to modify the entries in the “Values” column as they wish.
Additionally, you can also Allow or Deny the selected instance types. Just click the appropriate option(Allow or Deny) and select the relevant instance type from the dropdown list.
If you wish to increment or decrement values for certain rules, just use the up/down arrows.
Use the Manual Benchmarks for rules that are not automatically identified by the scanner. For Manual Benchmarks, by setting the values to:
- Unaudited — you can indicate the rules that have not been checked, either due to lack of data or because they were skipped in the scan
- Audited — you can ensure that the rule configurations are checked or verified against the benchmark
Prioritize Issues based on Criticality to System Security
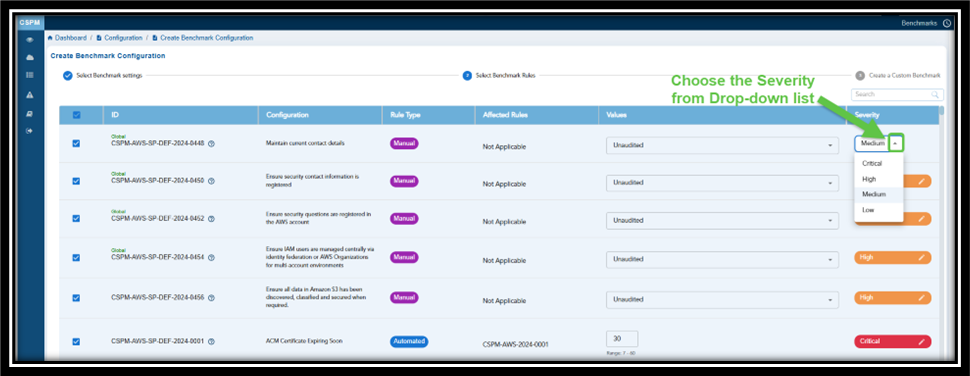
Severity in Benchmark rules indicate the level of risk or potential impact associated with each security configuration issue. It helps prioritize issues based on their criticality to system security. The levels shown in the image include:
- Critical: Indicates issues that pose the highest risk and require immediate attention to prevent severe security breaches.
- High: Represents significant risks that could lead to security vulnerabilities if not addressed promptly.
- Medium: Denotes moderate risks that are less urgent but still important to mitigate to maintain overall security.
- Low: Denotes risk of lesser severity and does not need immediate attention
This classification helps security teams focus their efforts on the most pressing compliance issues first.
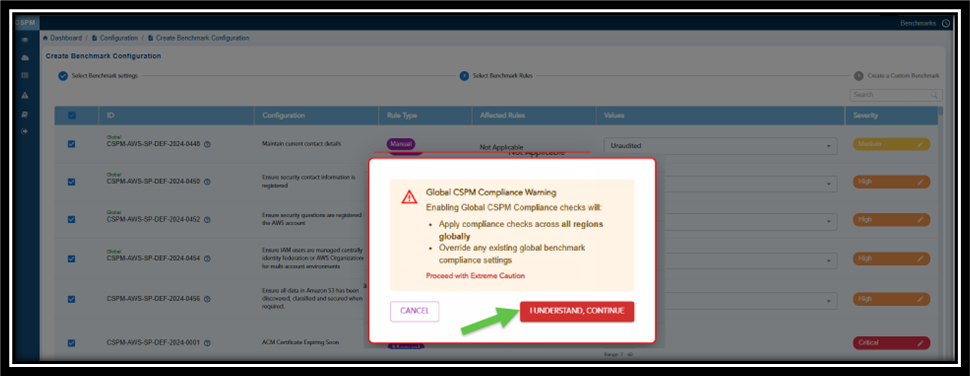
Click Next. The following Caution message displays. Click the button, I Understand and Continue to proceed with creating the Benchmark configuration.
What Can You Interpret from Global Benchmarks?
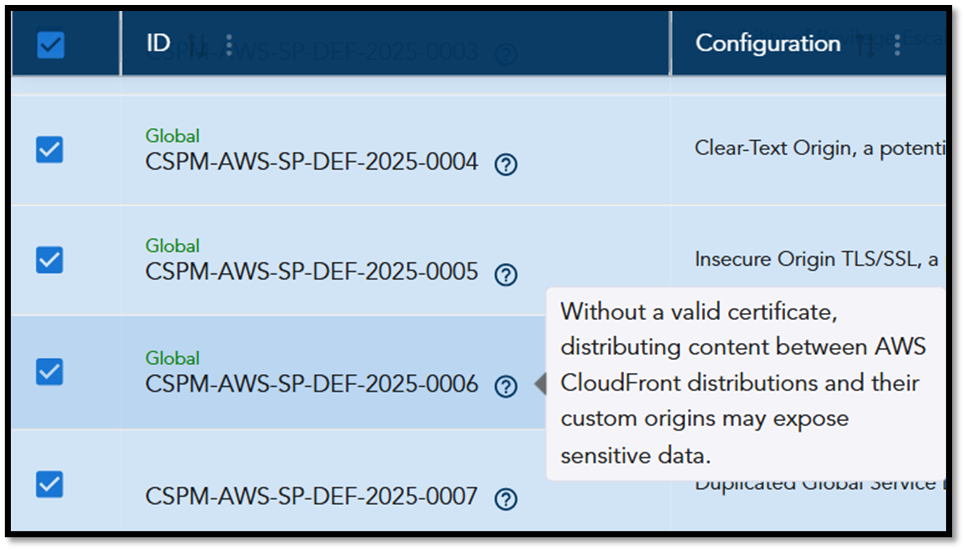
Global benchmarks assess services and configurations that are not region-specific. For example, AWS CloudFront is classified as a global service because it operates across multiple regions.
Saner CSPM offers guidance based on the findings from these global benchmarks by labeling these checks as “Global.” When you hover over the benchmark icon (represented as a “question mark”), it displays key insights explaining the importance of these checks and suggested actions to address any identified issues (see screenshot for an example).
Step 2: Choose Rules that Align with Security Standard
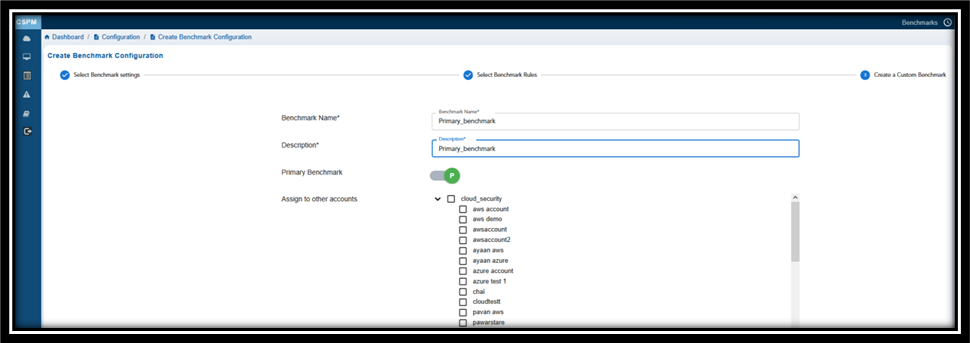
Provide a Name and Description to Your Benchmark.
If you want to specify this benchmark as a primary one, then turn on the Primary Benchmark slider.
Choose the rules that align with the specified security standard. Click the checkbox(es) to choose one or more rules that you want to map with the security standard.
In the Assign to Other Accounts, observe the current cloud account selected by default. If you’d want to apply this benchmark for any other account, then click the appropriate checkbox(es).
Note that only administrators have the privilege to select one or more accounts to assign the benchmark.
Lastly, click the Create New Benchmark button.
Step 3: Complete Benchmark Creation
On completing all the steps, the system applies the selected benchmark rules to the chosen regions and resources for evaluation.
Click Next to view the list of rule IDs, descriptions, affected Rules, along with the “Values” on the Configuration page.
How does the Benchmark Rule Work?
The benchmark rule system evaluates resources and services based on established security standards. It performs regular or on-demand scans to identify any misconfigurations or compliance gaps. After collecting the data, the system compares it against benchmark criteria, categorizing each finding as either a “Pass” or “Fail” to clearly indicate the compliance status. This process simplifies the tracking and remediation of vulnerabilities.
Use Quick Evaluation Benchmarks
Saner Cloud offers supplementary benchmarks in addition to the primary benchmarks. These secondary benchmarks are available for each region and are designed to complement the primary benchmarks by assessing compliance with various standards or internal policies, such as CIS Amazon Web Services, NIST, PCI DSS, or SecPod Default. “Quick Evaluations” provide flexible and faster scans that focus on specific areas or services.
Create a Benchmark for Quick Evaluation
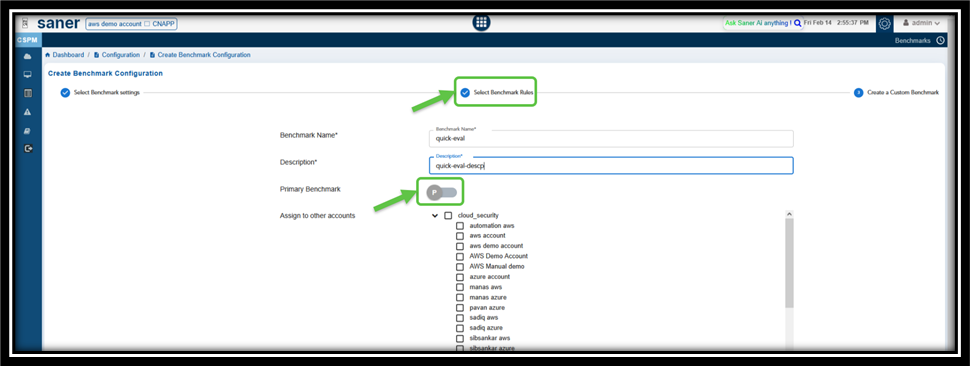
From the Select Benchmark Rules page, make sure to keep the Primary Benchmarks slider Turned Off when you create the benchmark rule and proceed with next steps.
KEY POINTS TO REMEMBER IN BENCHMARK CONFIGURATION
The system considers the most recently created, edited or updated benchmark as the active one. This means:
| If you want to… | Then you must… | Result |
|---|---|---|
| Replace the Default Benchmark | Create a custom benchmark that has the same configuration as the Default Benchmark | Message displays asking if you want to override the existing benchmark. Review the benchmark before you proceed to make the changes. Default Benchmark disappears from the “All Primary Benchmarks” block on the dashboard. Only the newly created custom benchmark displays. |
| Replace the Custom Benchmark | Edit or update the custom benchmark and save to make this the active one | Message displays asking if you want to override the existing benchmark. Review the benchmark before you proceed to make the changes. The modified custom benchmark displays as the active one in the “All Primary Benchmarks” block on the dashboard |
| Display all the Benchmarks | Slightly adjust the configuration to ensure the system supports displaying multiple benchmarks simultaneously | All the Benchmarks displays in the “All Primary Benchmarks” block on the dashboard |
Additional Benchmark Actions
1. View All the Configured Benchmarks
From the Benchmark Configuration list, you have an option to view all the configured benchmarks, edit regions, update rules, and delete the benchmark as needed. Just click the appropriate button and perform the requisite action.
2. Differentiate between Primary Benchmark and Quick Evaluation Benchmark from the Configuration List
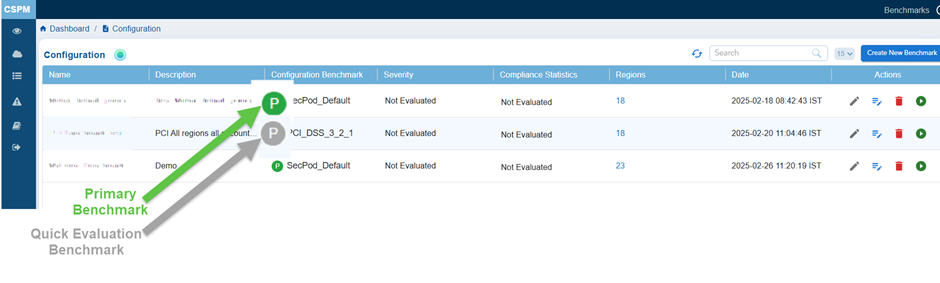
The primary or quick evaluation benchmark that you created displays in the Benchmark Configuration Details list. In the Configuration Benchmark column, observe the Primary Benchmarks indicated in a green circle and Quick Evaluation Benchmarks indicated in a grey circle.
3. Edit the Regions for Primary or Quick Evaluation Benchmarks
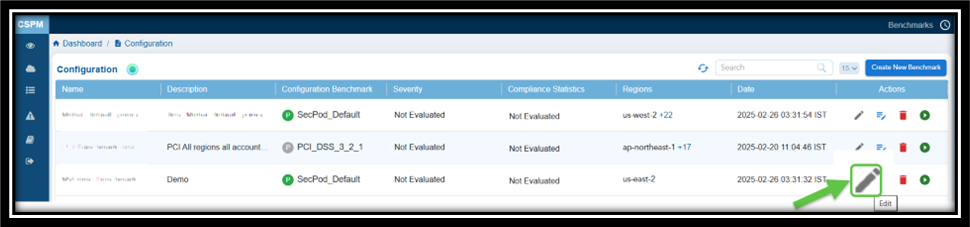
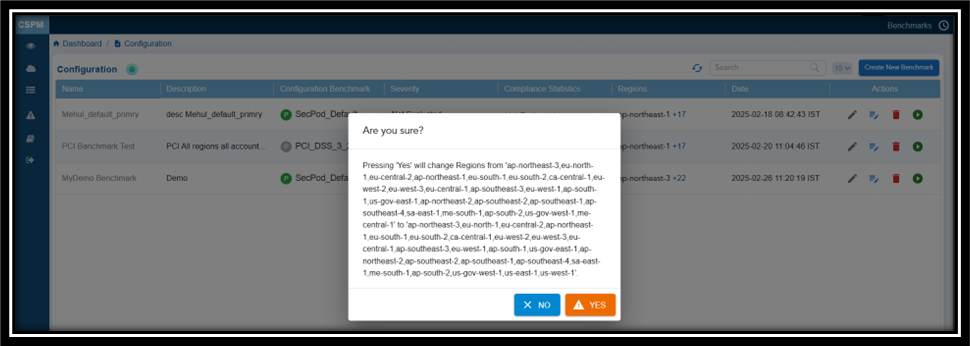
To edit a record, click the Edit button next to the relevant benchmark entry. This allows you to edit the cell under the Region column. Next, click the drop-down arrow and select or clear the checkboxes next to the desired regions. Finally, click the Save icon. A confirmation message appears. Click Yes to confirm your changes.
4. Update the Rules for Primary or Quick Evaluation Benchmarks
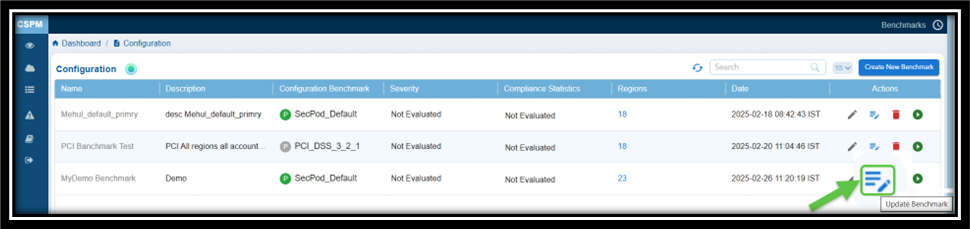
From the Benchmark Configuration list, click the Update Benchmark icon (under the Actions column) corresponding to a benchmark and proceed to modify the Benchmark Rules.
5. Run Scan on the Quick Evaluation Benchmark
Click the Scan button under the Actions column on the Benchmark Configuration Details page. Once the scan completes, the severity of the benchmark displays as applicable.
6. Re-evaluate the Benchmark
You have an option to reevaluate the benchmark by clicking on the Scan button on the Benchmark Configuration details page. Once the scan completes, the severity of the benchmark and compliance displays as applicable.
7. Delete the Benchmark
From the Benchmark Configuration list, click the Delete icon(under Actions column) corresponding to a Primary or Quick Evaluation Benchmark.
8. View the Current Data Using Refresh
Simply click the Refresh button on the Benchmark Configuration page and see the updated information.
9. Search by Specific Benchmark Information and Retrieve Results
You can do a standard keyword search based on:
- Name
- Compliance Type
- Configuration Benchmark
How to Assess System Compliance and Security Posture?
From the “All Primary Benchmarks” Block
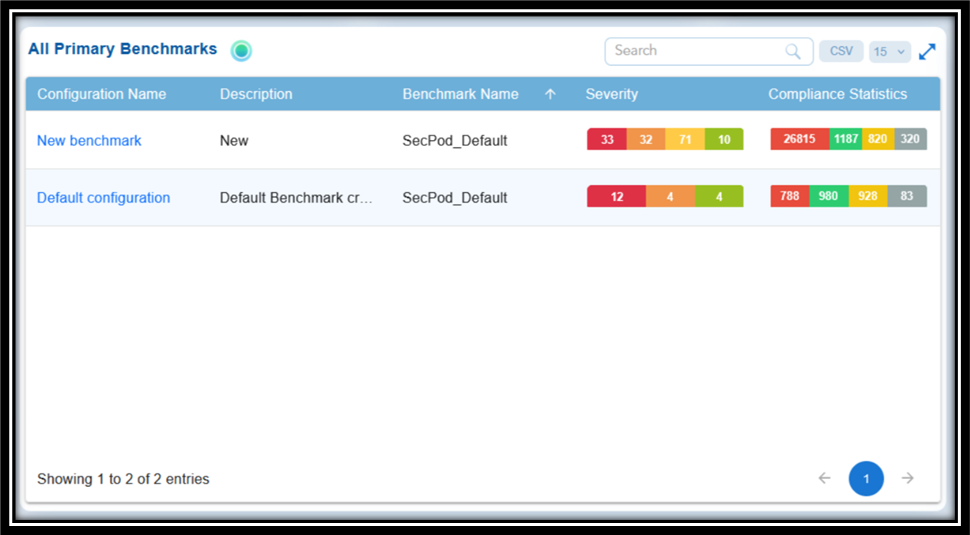
From the “All Primary Benchmarks” block in the Saner CSPM dashboard, take a look at:
- All Benchmark Configurations used to evaluate system security. This helps in tracking compliance across multiple resources
- Benchmark Details that displays the Configuration Name, Description, and Benchmark Name (e.g., SecPod_Default), indicating which standards are applied (like CIS, NIST, etc.)
- Severity Assessment that indicates the risk level(Not Evaluated, Critical, High, Medium, Low) of identified vulnerabilities in different color codes
“Not Evaluated” status indicates that scanning has not taken place for the primary benchmark(s). Only after scanning completes, the relevant statuses: critical, high, medium, or low displays.
- Compliance Statistics that provide quick insights into compliance levels (e.g., the score 601 might represent compliant checks, pending patches, or specific policy metrics)
Detect Patterns over a Period with Resource-Trends
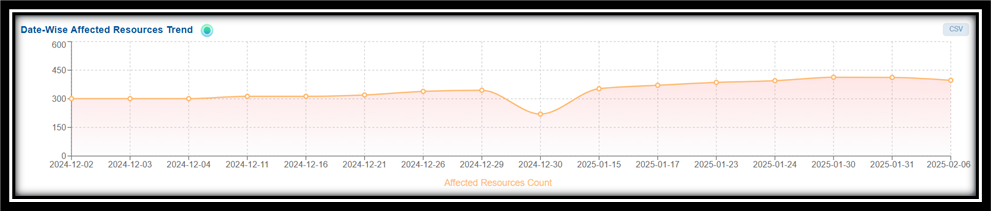
Step 1: Launch Saner CSPM
Step 2: Go straight to the “Date-Wise Affected Resources Trend” block on the dashboard.
Step 3: Identify seasonal variations, predict and prepare for recurring vulnerabilities and mitigate future security risks.
Commonly Asked Questions
What can I infer from the “Findings by Cloud Provider” and how does this contribute to my overall security posture management?
The pie chart displays the total number of resources evaluated across various cloud providers (for example, AWS, Azure) and highlights any configuration risks found during the latest scan.
IT teams can make informed decisions with the real-time view of configuration risks across cloud services and easily identify high-risk areas and prioritize remediation.
What qualifies a finding as “Critical”?
Critical findings include serious security and compliance issues such as exposed sensitive data, unrestricted network access, and significant compliance failures that need immediate attention.
How does the “Publicly Accessible Resources” chart support risk management?
By identifying exploitable resources and providing actionable details, the chart helps users prioritize and address network vulnerabilities quickly. The detailed breakdown view, users can gather further details on the remediation steps with guidance on how to resolve each finding effectively.
I want to detect patterns such as recurring security vulnerabilities, spikes in affected resources, or periods of stability. How is this possible?
From the trends chart you can gain insight into these and take proactive steps to improve security.
I want to predict future vulnerabilities. How can I do it from the dashboard?
From the trends chart you can identify seasonal variations, predict and prepare for recurring vulnerabilities and mitigate future security risks.
What is a CSPM Benchmark and which one should I choose for my organization?
Saner CSPM (Cloud Security Posture Management) Benchmark refers to a set of standards or guidelines designed to evaluate the security posture of your cloud environment. These benchmarks assess your cloud configuration, identify potential vulnerabilities, and recommend improvements to ensure compliance with best practices and regulatory requirements. When selecting the right benchmark for your organization, several factors should be considered, including industry and regulatory requirements, the cloud provider environment, and compliance needs.
How do I create a CSPM Benchmark?
The Saner CSPM Default Benchmark offers a pre-configured, regulatory-compliant assessment framework designed to streamline risk identification and mitigation across cloud environments. Built with industry best practices in mind, this benchmark includes standardized rules that evaluate specific resource configurations, displaying compliance results directly on the dashboard for enhanced visibility and accessibility.
What are the different CSPM Benchmark settings and what do they signify?
Saner Cloud Security Posture Management (CSPM) utilizes various benchmark settings to assess and improve the security of cloud environments. These benchmarks align with industry standards, regulatory frameworks, and security best practices.
Some common CSPM benchmark settings and their significance:
— NIST: Commonly used by U.S. government agencies and organizations in highly regulated industries
— PCI DSS: Essential for organizations handling payment card data to avoid breaches and ensure compliance
— HIPAA: Critical for organizations dealing with healthcare data to avoid penalties and protect patient information
— CIS: Helps organizations comply with industry standards, reduce attack surfaces, and achieve baseline cloud security
How do I edit a benchmark?
Access the Detailed view from Saner CSPM dashboard and make the necessary changes.
How do I identify critically vulnerable assets from not critically vulnerable assets?
The Severity, Service, and Resource Type columns provide a comprehensive view of security risks where “Critical” severity implies an immediate need for remediation especially if associated with core services or sensitive resources across different geographic regions.
The All Findings view in the CSPM Benchmarks presents a streamlined view of security findings (issues) across the selected cloud service. This enables users to prioritize remediation efforts based on the severity of issues and the number of affected resources.
Based on your selection of “Failed,” “Passed,” or “Unchecked,” the relevant information displays in the following columns:

- ID: Unique identifier assigned to individual cloud security findings and indicates the tool(CSPM), cloud provider(AWS, Azure, or GCP), the year the rule was defined, and a sequential finding number. These identifiers help users quickly reference, sort, and distinguish findings across different regions or resources
- Title: A brief explanation of the security issue
- Benchmark: The compliance(Regional, Global, or Both) to which the is assigned to benchmark during configuration
- Benchmark Rule: Security check that evaluates specific configurations or behaviors, determines compliance, and provides guidance for remediation.
- Rule Type: The rule type applied to the benchmark. Manual rules require human intervention to verify compliance. For example, checking physical security policies or manually reviewing rules. On the other hand, Automated rules or security checks do not require any additional configurations, manual inputs, or user intervention. For example, checking if disk encryption is enabled via automated scans.
- Region: One or more regions impacted by the cloud service
- Number of Affected Resources: The count of resources impacted by each finding
- Resource Count: The number of resources impacted by each finding
- Services Type: The specific cloud service (e.g., CloudFormation, CloudFront, CloudTrail, ConfigService)
- Resources Type: The type of resources affected (e.g., Stack, Distribution, Trail, ConfigurationRecorders)
- Severity: In Cloud Security Posture Management (CSPM), severity indicates the impact or criticality of a detected risk, misconfiguration, or vulnerability. This helps teams prioritize remediation efforts based on urgency. Severity levels typically include Critical, indicating the most serious issues requiring immediate action; High, covering major risks that needs resolution promptly; Medium, representing moderate-impact concerns; Low, for minor issues with limited risk.
- Fix displayed by a wrench icon to carry out the Remediation tasks for the selected security finding id. Note that the “Fix” option turns on only for “Failed” findings.
You can filter the severity to focus specifically on “Critical” findings, allowing IT teams to address the most pressing issues and streamline their responses. Just follow a link pertaining to an Id and get a detailed breakdown that includes:

Finding Overview

The finding emphasizes a critical issue. For example, in AWS CloudFront insecure or outdated TLS/SSL protocols are being used between CloudFront distributions and their custom origins. This vulnerability could expose sensitive data. The report includes important metadata such as the first detection date, the last scan date, service type, and resource type. Additionally, it provides reference links to AWS documentation on how to secure HTTPS communication with CloudFront.
Affected Resources Summary

The graph shows the distribution of Affected versus Non-Affected resources. In this example it indicates the number of CloudFront distributions that fail to meet secure TLS/SSL requirements. The chart helps quickly assess the overall compliance status and the proportion of resources requiring attention.
Trend Analysis
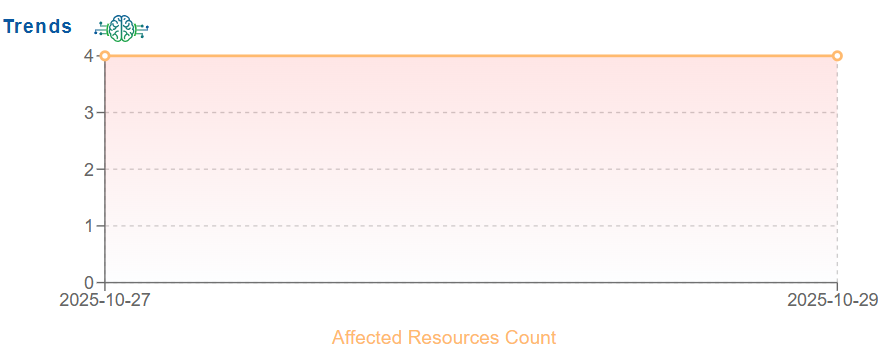
The trend graph tracks the number of affected resources during a specific period. In this example, the trend analysis is tracked between 2025-10-27 and 2025-10-29, illustrating that the issue lasted consistently across this period. This historical view helps identify whether the security posture is improving, worsening, or remaining unchanged over time.
Affected Resources Table
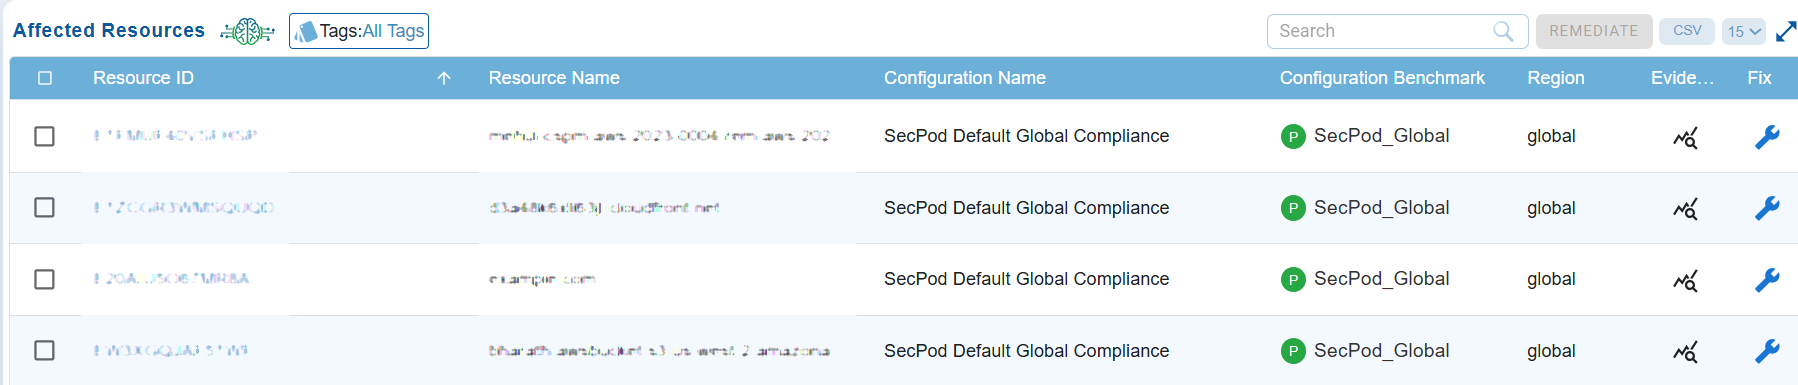
The table lists detailed information about every impacted distribution. In this example, it displays the CloudFront distribution, including resource IDs, domain names, compliance configuration, benchmark applied, region, and available evidence. It also offers options to search, export data, or initiate remediation, enabling administrators to review and fix affected resources efficiently.
How do I check critically vulnerable assets only in specific region?
The Severity, Service, and Resource Type columns provide a comprehensive view of security risks where “Critical” severity implies an immediate need for remediation especially if associated with core services or sensitive resources across different geographic regions.
The All Findings details in the CSPM Benchmark presents a streamlined view of security findings (issues) across the selected cloud service. This enables users to prioritize remediation efforts based on the severity of issues and the number of affected resources.
Based on your selection of “Failed,” “Passed,” or “Unchecked,” the relevant information displays in the following columns:
- ID: The Unique identifiers assigned to individual cloud security findings indicates the category (CSPM), the cloud provider (AWS, Azure), the year the rule was defined, and a sequential finding number. These identifiers help users quickly reference, sort, and distinguish findings across different regions or resources
- Title: A brief explanation of the security issue
- Benchmark: The name assigned to the benchmark during creation
- Benchmark Rule: Security check conducted by Saner CSPM to verify if the resource meets the required security standard. It evaluates specific configurations or behaviors, determines compliance, and provides guidance for remediation.
- Rule Type: The two types of patching methods include Automated and Manual. In Automated mode, Saner CSPM dynamically identifies and populates all the parameters needed to patch a specific resource using detection mechanisms. In Manual mode, you must manually provide all the necessary parameters required to patch the resource.
- Region: One or more regions impacted by the cloud service
- Number of Affected Resources: The count of resources impacted by each finding
- Resource Count: The number of resources impacted by each finding
- Services Type: The specific cloud service (e.g., CloudFormation, CloudFront, CloudTrail, ConfigService)
- Resources Type: The type of resources affected (e.g., Stack, Distribution, Trail, ConfigurationRecorders)
- Severity: In Cloud Security Posture Management (CSPM), severity indicates the impact or criticality of a detected risk, misconfiguration, or vulnerability. This helps teams prioritize remediation efforts based on urgency. Severity levels typically include Critical, indicating the most serious issues requiring immediate action; High, covering major risks that needs resolution promptly; Medium, representing moderate-impact concerns; Low, for minor issues with limited risk.
- Fix displayed by a wrench icon to carry out the Remediation tasks for the selected security finding id. Note that the “Fix” option turns on only for “Failed” findings.
The Geographical Map highlights affected locations: red dots indicate regions with issues, and green dots represent regions without any problems.
What can I do to improve my Cloud Security Posture?
Apply appropriate the Benchmarks for your organization and monitor for misconfigurations. For more details refer to “How to Setup Benchmarks in Saner CSPM?“.

