The Resources Severity Distribution chart shows how all resources are spread across 4 severity levels: Poor, Fair, Good and Excellent. This provides a quick overview of the overall condition of resources, highlighting areas that are performing well and those that may require closer attention. The chart helps in identifying priorities for improvement while also tracking the proportion of resources maintaining
Review Resource Distribution by Severity Levels at Organization-Level
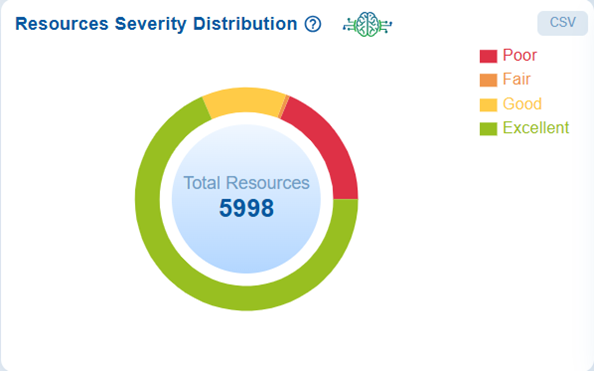
The Resources Severity Distribution chart displays the total count of resources categorized into 4 severity levels: Poor, Fair, Good, and Excellent. This visualization provides insights into the overall health and risk profile of organization-level resources. Additionally, this breakdown enables security teams to quickly identify critical areas that require immediate remediation, while also acknowledging the areas that are performing well in terms of cyber hygiene.
Review Resource Distribution by Severity Levels at Account-Level
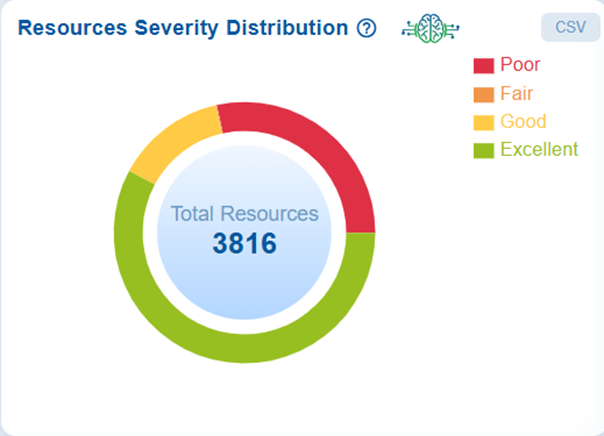
The Resources Severity Distribution chart displays the total count of resources categorized into 4 severity levels: Poor, Fair, Good, and Excellent. This visualization provides insights into the overall health and risk profile of account-level resources. Additionally, this breakdown enables security teams to quickly identify critical areas that require immediate remediation, while also acknowledging the areas that are performing well in terms of cyber hygiene.
See Also

