Saner Cloud allows organizations to evaluate the distribution of risks across various cloud providers at both the organizational and account levels. At the organizational level, it offers a consolidated view of risks across all connected providers, helping to provide a comprehensive understanding of the overall security posture. At the account level, it delivers a detailed breakdown of risks within individual accounts, enabling security teams to identify and effectively address specific vulnerabilities.
At Organization Level
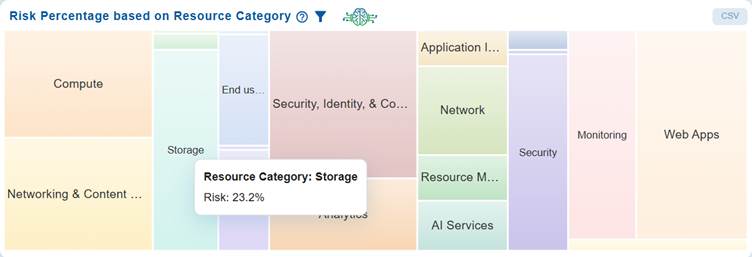
The Risk Percentage based on Resource Category chart utilizes a heat map to illustrate the proportion of risk associated with various types of resources across AWS, Azure, or GCP.
At Account Level
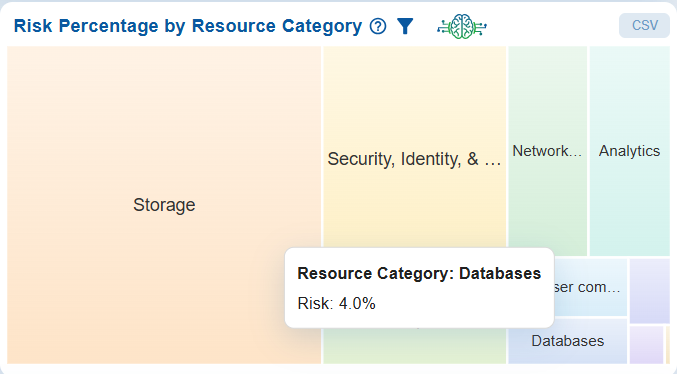
The Risk Percentage by Resource Category chart utilizes a heat map to illustrate the proportion of risk associated with various types of resources, including Compute, Databases, Networking & Content Delivery, Analytics, Security & Compliance, and Storage.
Each block in the chart represents a resource category, with its size and shading indicating the relative level of risk. For example, Databases account for 4.0% of the overall risk.
This visualization effectively highlights which categories contribute most to organizational risk, allowing for better prioritization of remediation efforts across different resource types.
See Also

