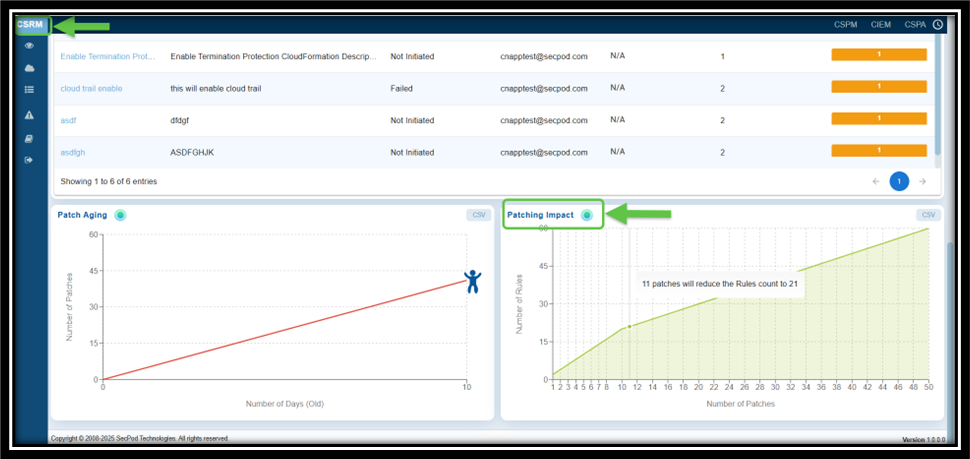
The Chart plots the number of security rules fixed against the number of patches applied, offering a clear understanding on the effectiveness of remediation efforts.
You can also prioritize patches that have the maximum impact, ensuring critical anomalies are addressed first. The graph also illustrates the relationship between the number of patches applied and the reduction in the number of rules.
- X-Axis indicates the number of patches applied
- Y-axis indicates the number of rules affected. The point that you highlight by moving your cursor indicates the impact of patching on reducing vulnerabilities or misconfigurations.
See Also

