Analysing the overall anomaly information tied to specific rules or checks is crucial for effective posture management and remediation in cloud environments. This process ensures a comprehensive understanding of security, compliance, and misconfiguration issues, enabling more informed decision-making.
Here’s why it matters…
Centralized Navigation and Detailed Investigation — Dashboard Interactivity: Navigating from summary-level insights to in-depth details via clickable links (e.g., Rule ID) allows seamless transitions between overviews and granular anomaly data. This functionality streamlines the investigation and remediation processes by reducing the time spent searching for information.
— Enhanced Contextual Understanding — Posture Anomaly Density and Details Views: Accessing anomalies through these dashboards provides a clear view of each anomaly, including:
Rule ID: Direct navigation to the anomaly’s details.
Summary: A description of the rule, total resources evaluated, and anomaly count.
Example: “22 instances of resources are checked, of which 11 have anomalies.”
This detailed breakdown helps security teams quickly grasp the nature and scope of the problem.
Prioritization of Anomalies Based on Confidence Level(High, Medium, Low) — Anomaly Status Categorization: Allows teams to focus resources on resolving the most impactful issues first.
Tracking Trends and Mitigation Process — Anomaly Trends Over Time: Graphical representations of anomalies over time help visualize the frequency and recurrence of issues, revealing patterns in misconfigurations or security violations. These insights can guide proactive measures to mitigate recurring issues.
Geographic Analysis of Risks — Region-wise Mapping: Identifying misconfigurations prevalent in specific regions aids in tailored security measures.
How to Access Additional or Overall Information of an Anomaly
You have an option to access additional information of an anomaly associated to a specific rule or check from the dashboard views:
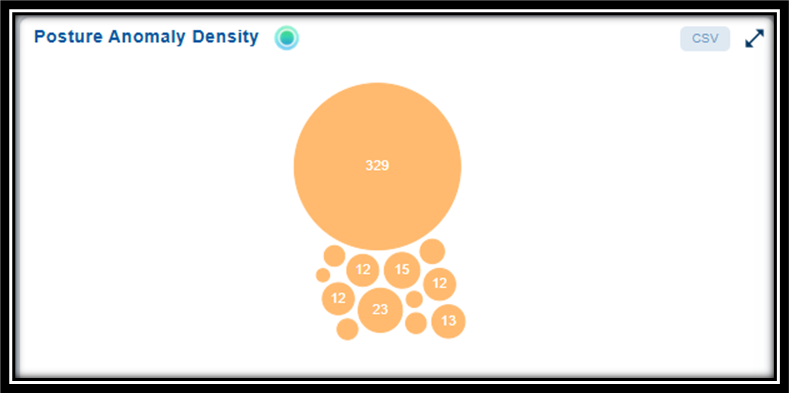
Posture Anomaly Density: Clicking on any bubble in the chart navigates you to the relevant Posture Anomaly Parameters, providing the details of the anomaly: ID, Title, and the number of Resources that have an anomaly. Clicking the rule ID(link) further navigates you to the Additional Details page that displays the overall anomaly information.
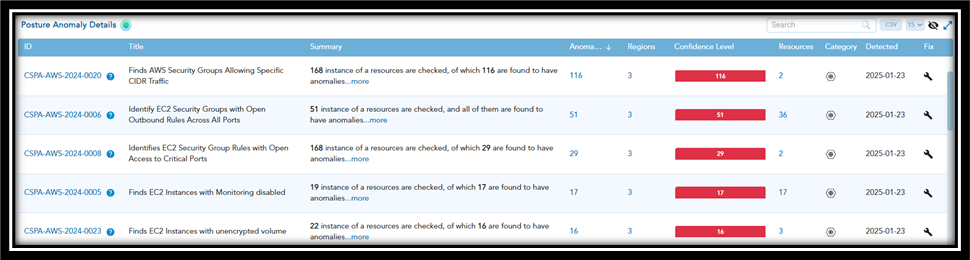
Posture Anomaly Details: Clicking on a specific rule ID(link) navigates you to the Additional Details page that displays the overall anomaly information.
What Constitutes the Overall Anomaly Information for Your Analysis
- Rule ID: provides the rule ID with the Title
- Summary: Description of the rule or check, alongside the total number of resources evaluated and the count of anomalies identified. For example, “22 instances of resources are checked, of which 11 are found to have anomalies”
- Anomaly Status: The total count of all detected anomalies together with a breakdown of anomalies categorized by:
- Red: High confidence anomalies. For example, Publicly accessible S3 bucket containing sensitive information, Misconfigured IAM roles with over-permissive policies exposing critical systems
- Orange: Medium confidence anomalies. For example, Unusual but authorized use of privileged accounts, A resource not encrypted where encryption is recommended but not required
- Yellow: Low confidence anomalies. For example, Access from an unusual IP address that aligns with a known employee’s travel, Temporary policy change flagged as non-compliant but corrected soon after
- Anomaly Trends Over Time: Graphical representation of the count of anomalies related to misconfigurations, policy violations, or security incidents over a specific period. The data displayed on the dashboard is updated after each scan.
- Region Wise Mapping: Total number of affected regions and anomalies on a world map and helps understand the distribution of resources across the cloud. The dots indicate the specific regions with anomalies. By moving your cursor over the dots, you can pin-point anomalies or vulnerabilities specific to regions.
See Also

