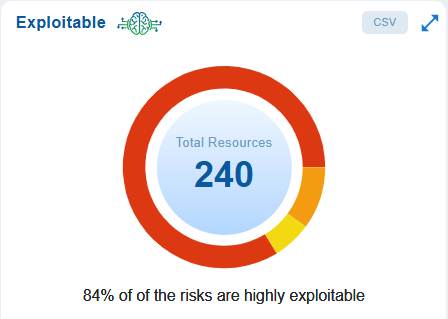
The “Exploitable” measure determines the present state of risk exploitation and displays the resource distribution in the Exploitable dashboard block as a pie chart with different color shades. The risk count is expressed in percentage and categorized into High, Medium, and Low.
To get a full view of the chart, just click the double-arrow icon at the top-right corner of the dashboard block.
The dashboard chart emphasizes the importance of risk prioritization based on exploitability.
In this case, out of a total of 240 resources, 84% of the identified risks are highly exploitable, indicating that attackers can easily take advantage of these issues if they are not addressed. Since the exploitability of these risks directly influences the likelihood of a successful attack, it is essential to prioritize the remediation of these high-risk items over those that are less exploitable.
The count is subject to change based on the scan run.
Related Topics

