Step 1: Launch Saner CSAE
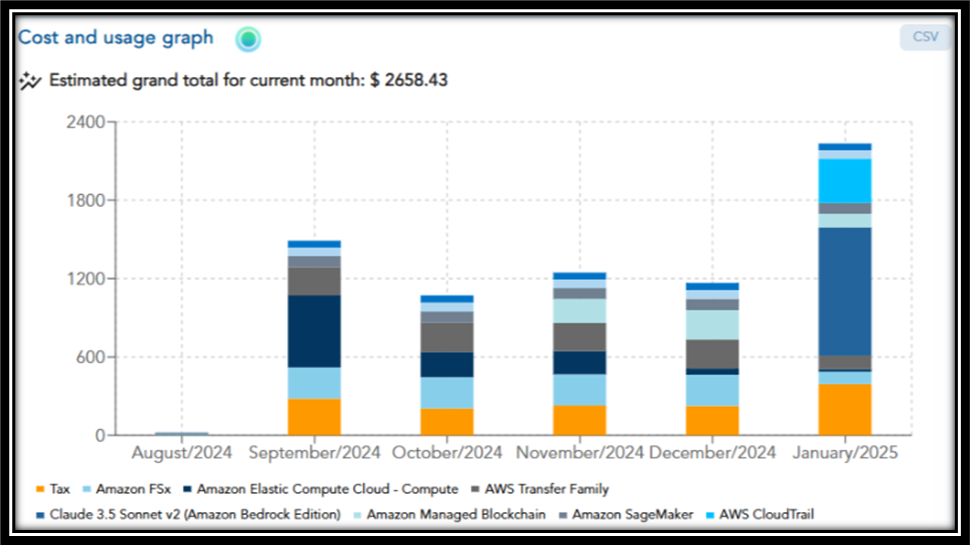
Step 2: Go straight to the “Cost and Usage Graph” block on the dashboard
Step 3: View the breakdown of resource usage across different months. Alternatively, from the CSV spreadsheet, select the values for the preferred resources and months to analyse the total expenditure.
See Also

