The Resources Risk Trend graph tracks the movement of resources across various risk categories: Poor, Fair, Good, and Excellent. These transitions impact the overall Cyber Hygiene Score (CHS).
At Account Level
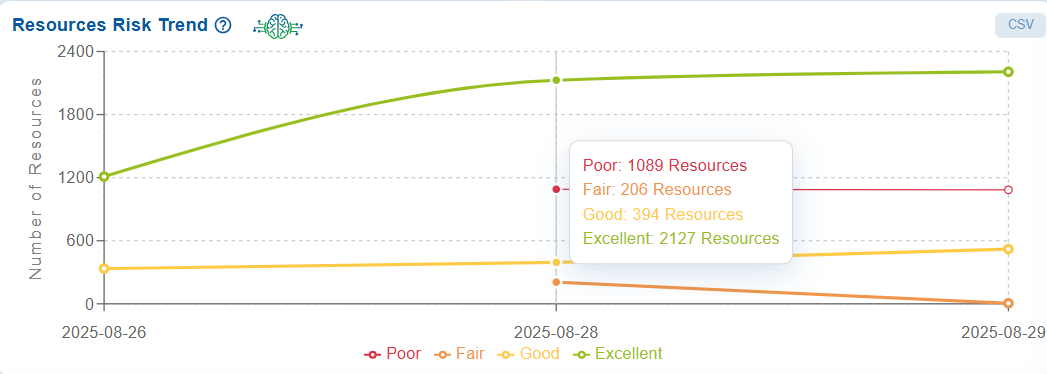
Move your cursor over the data point in the chart to display the latest count for the different risk categories in a tooltip.
This trend analysis is essential for evaluating the effectiveness of remediation efforts, monitoring changes in security posture, and prioritizing actions to enhance the overall cyber hygiene.
You also have an option to export the data into a spreadsheet by clicking the CSV button on the top-right of the block.
See Also

