Overview
SanerNow has a new interactive dashboard – Unified Dashboard – that provides a whole new representation of end-to-end vulnerability management through a unified console. The Unified Dashboard paints a clear and concise picture of your organization’s security posture, covering Visibility, Detection, Prioritization, and Remediation all in one console.
Unified Dashboard aims to ease your navigation between SanerNow tools and provide the necessary insights and recommendations to keep your organization secure. And this consolidated data is available at an Organization level and Account level.
Unified Dashboard
SanerNow Unified Dashboard provides information at the Organization and Account levels. The Organization level unified dashboard contains all the information of the Accounts within the organization. In comparison, an Account level Unified dashboard contains Account specific information.
The Unified Dashboard is divided into the following sections.
- Visibility
- Detection
- Prioritization
- Remediation
Visibility
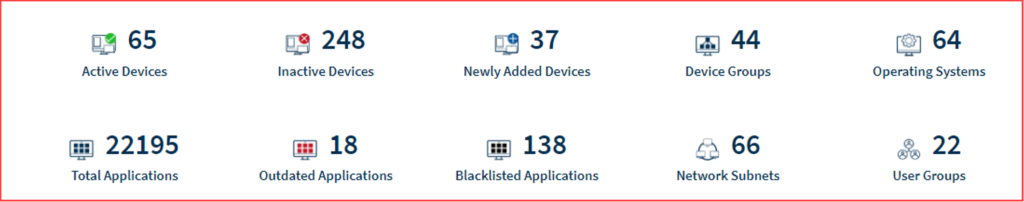
Device Universe
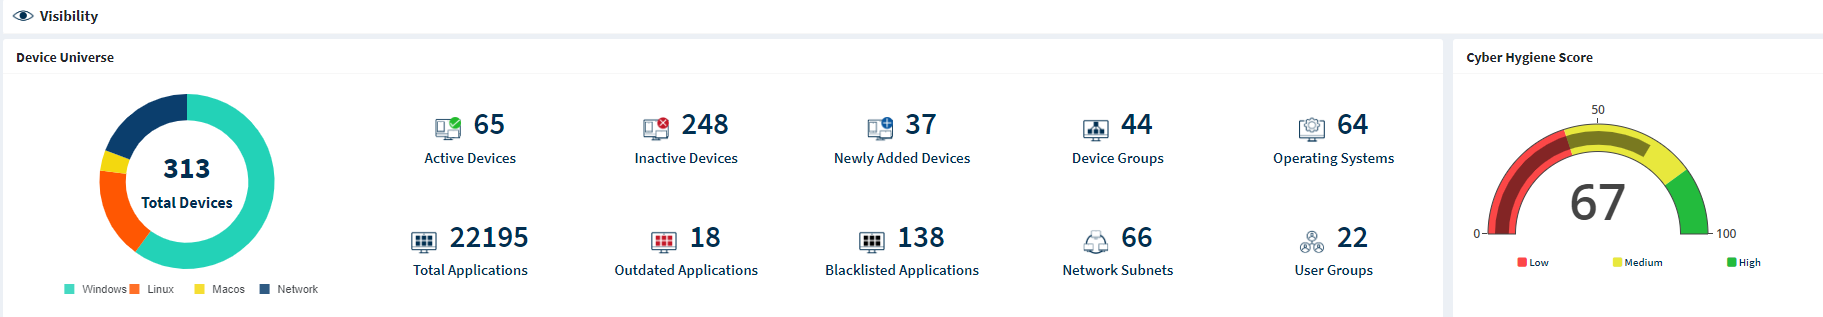
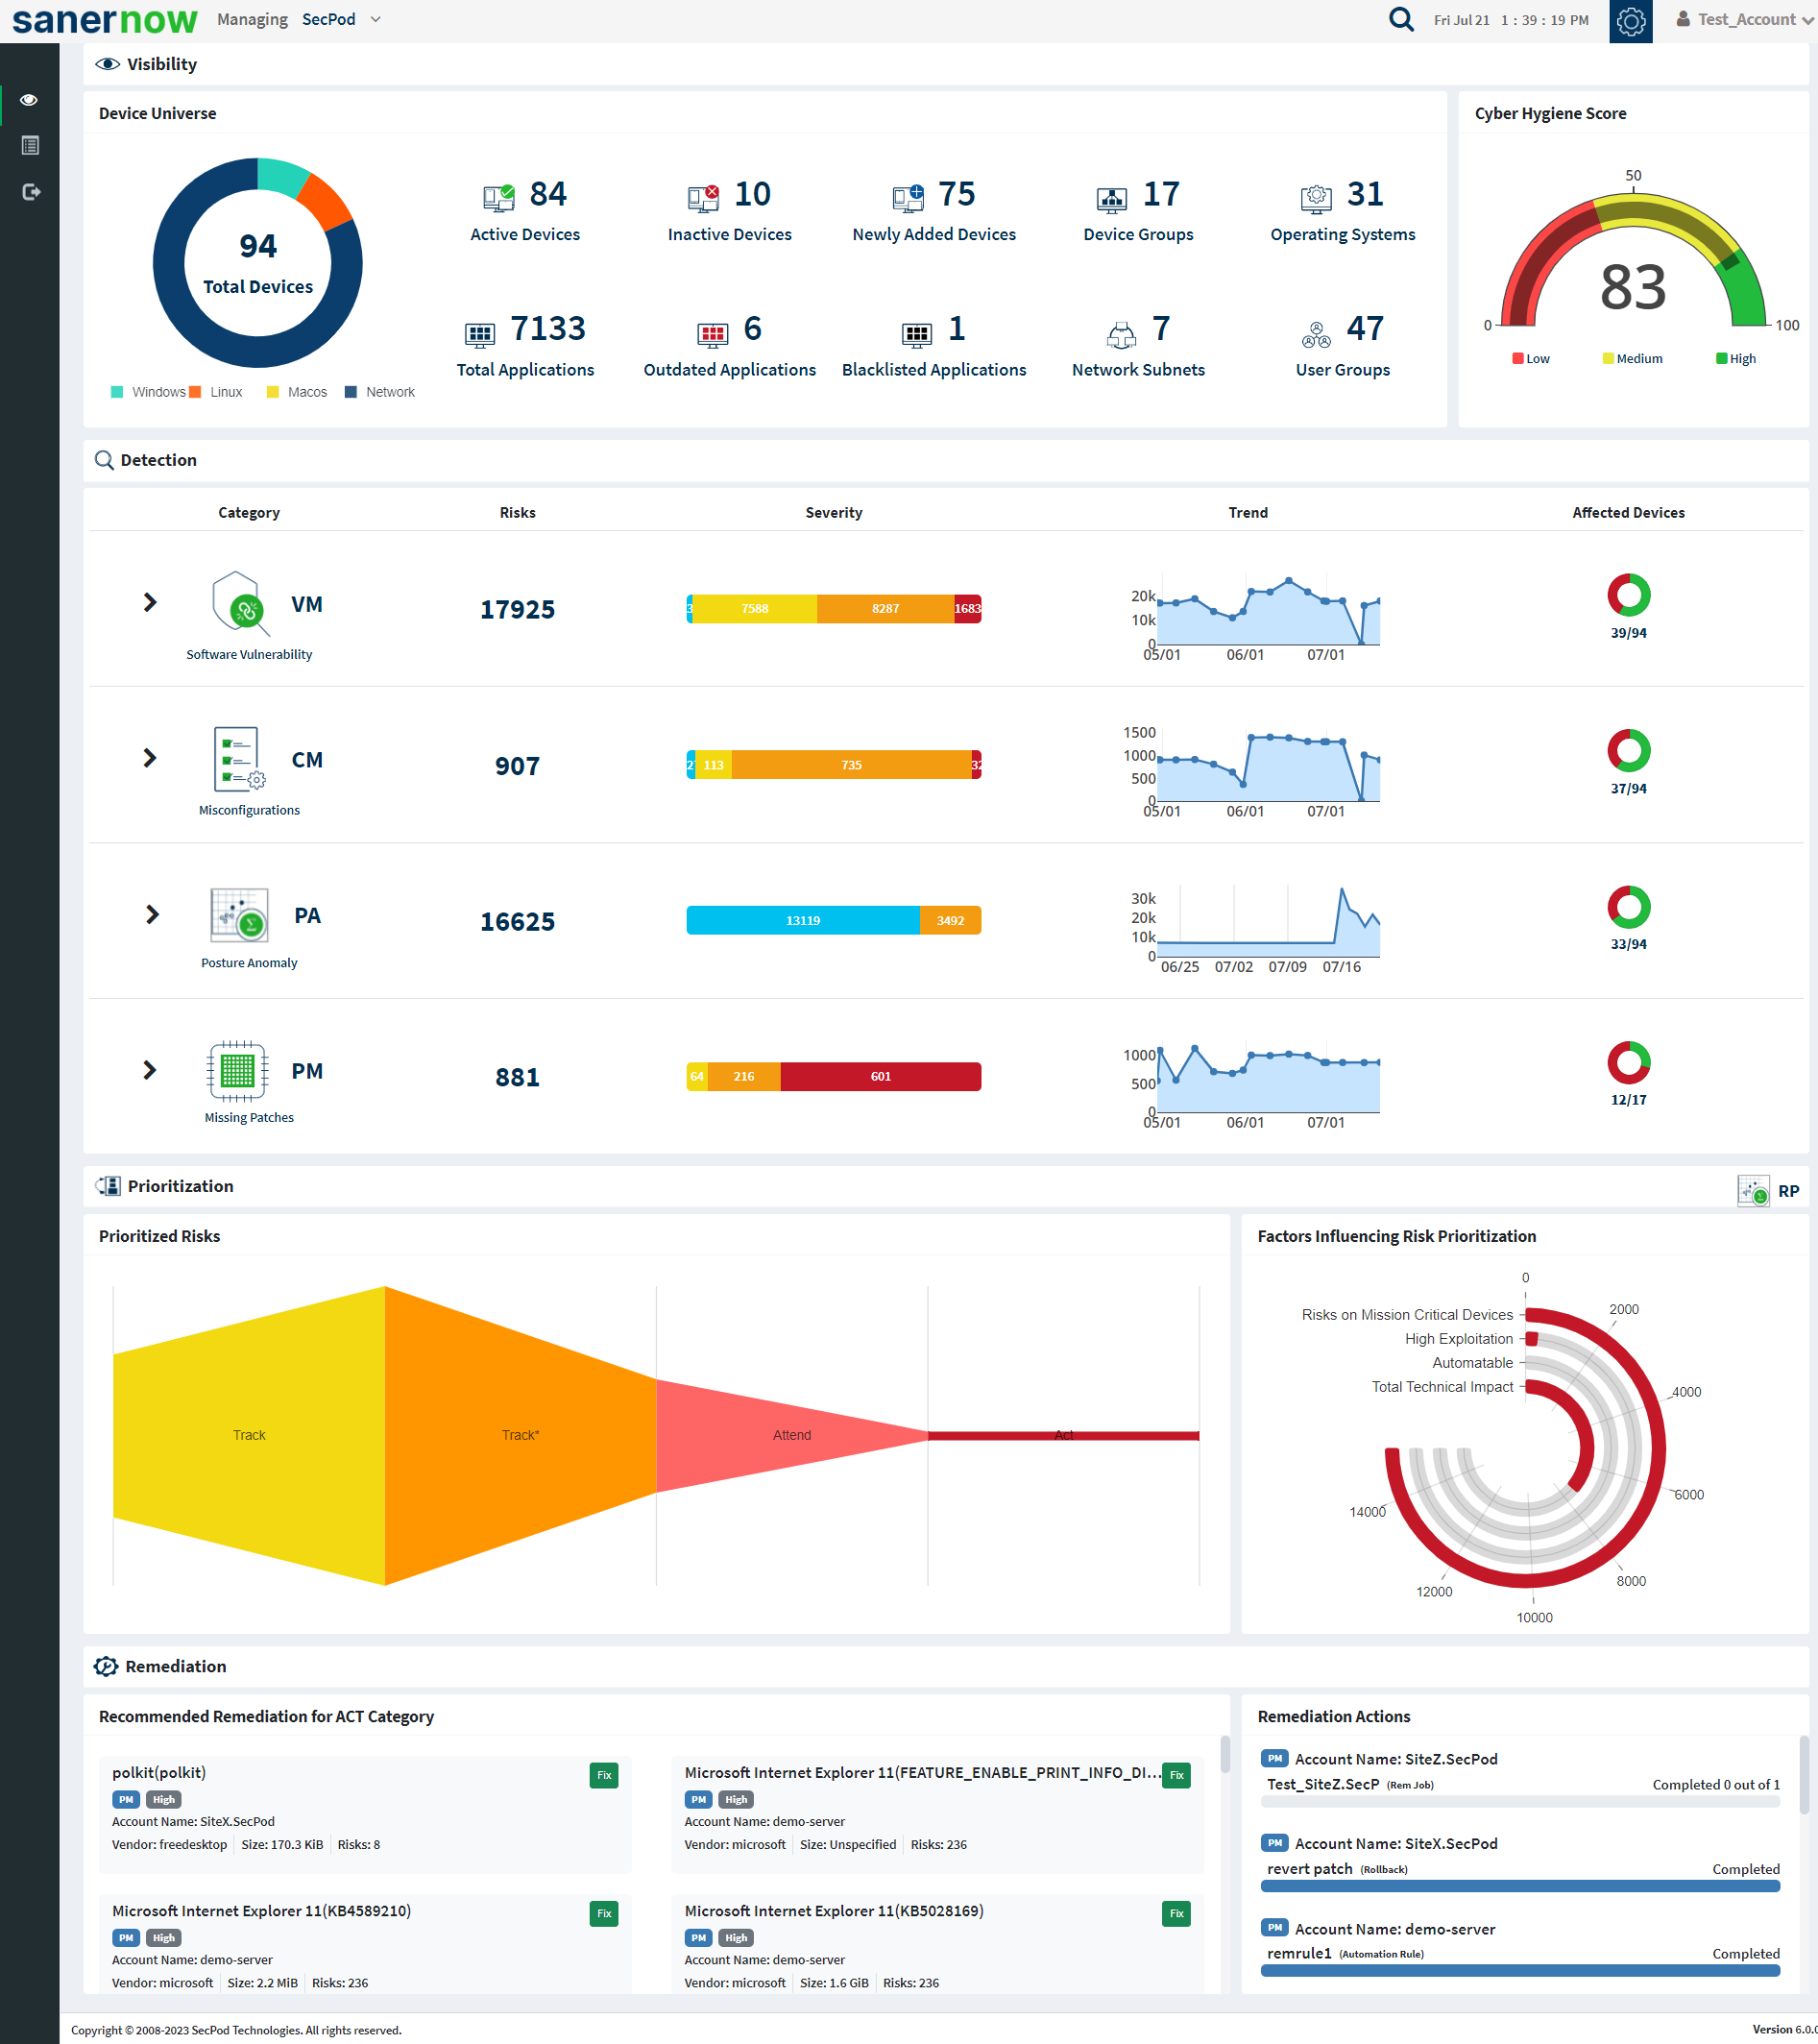
The Device Universe section gives detailed information about the Assets in your Organization. At an Account level, the Device Universe section shows information about the Assets in an Account. For instance, the pie chart on the left side of the page represents the total number of devices in the Organization, classifying them depending on the family of operating systems they belong to and categorizing remote scanned devices as Network devices. At the same time, the Device Universe section gives a granular view by breaking down the Asset information as mentioned in the table below.
| Icon | Information Represented at Organization level / Account level |
|---|---|
 | Shows the total number of active devices in the Organization / Account. |
 | Shows the total number of inactive devices in the Organization / Account. |
 | Shows the total number of newly added devices during the last one week in the Organization / Account. |
 | Shows the total number of device groups in the Organization / Account. |
 | Shows the total number of operating systems found in the Organization / Account. |
 | Shows the total number of applications present in the Organization / Account. |
 | Shows the total number of outdated applications present in the Organization / Account. |
 | Shows the total number of blacklisted applications present in the Organization / Account. |
 | Shows the total number of network subnets that exist in the Organization. |
 | Shows the total number of user groups in the Organization / Account. |
For Blacklisted Applications to be visible in the Device Universe, the Organization should have an active subscription to the SanerNow Asset Exposure tool. Similarly, the Account should have an active subscription to SanerNow Asset Exposure to display blacklisted applications in the Account-level Device Universe section. |
The Device Universe section at an Organization level provides account-wise information that can be downloaded into a CSV file. Click on any of the categories in the Device Universe section to download the information to a CSV file.
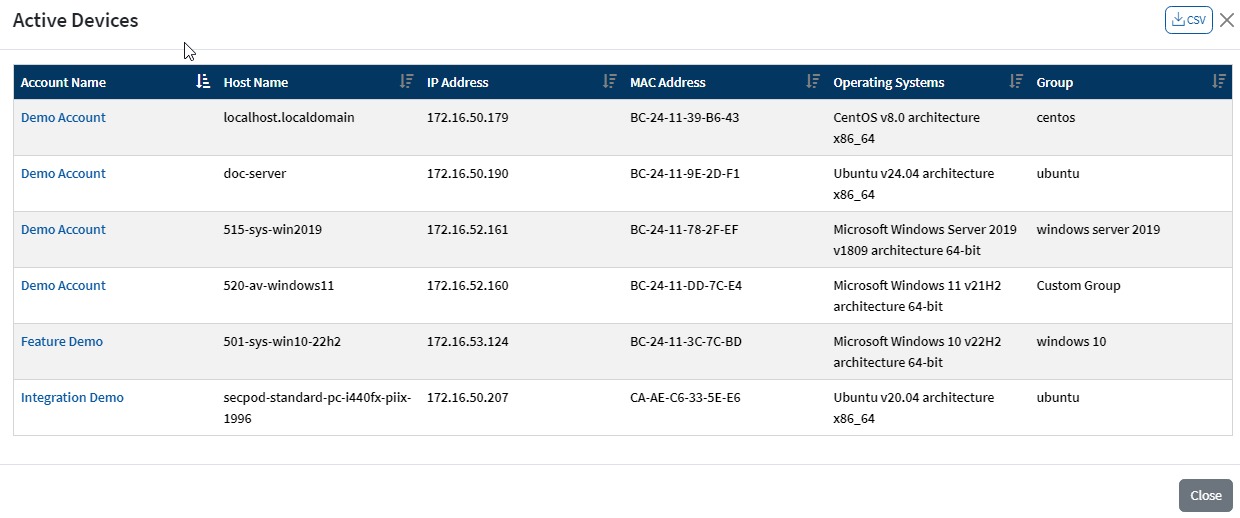
In addition to this, the Device Universe section at an Account level provides additional information. All you need to do is, click the number next to the icon in the Device Universe section, and a pop-up window showing all the details about the category is displayed. You can download the information presented in the pop-up window to a CSV file.
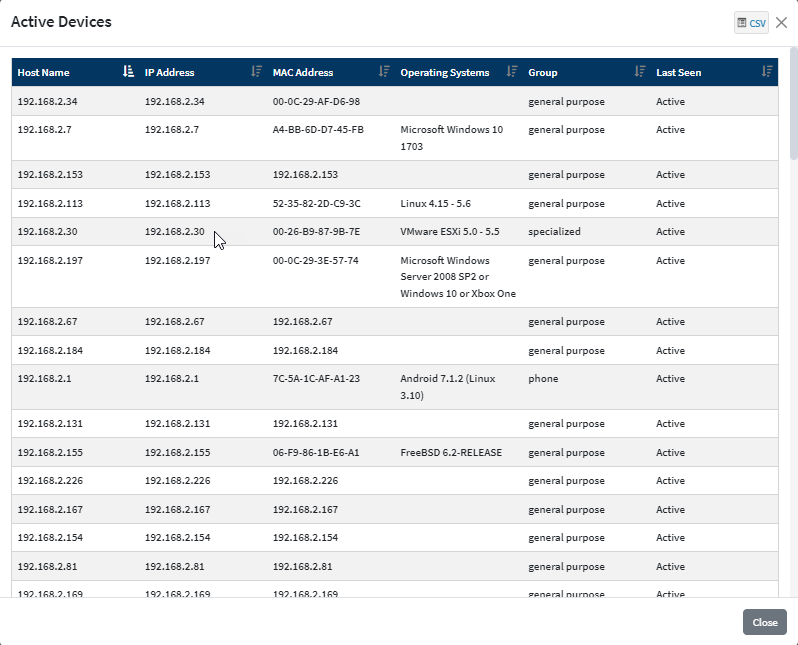
You can download the details by clicking the CSV ![]() icon on the top right of the pop-up window.
icon on the top right of the pop-up window.
Cyber Hygiene Score
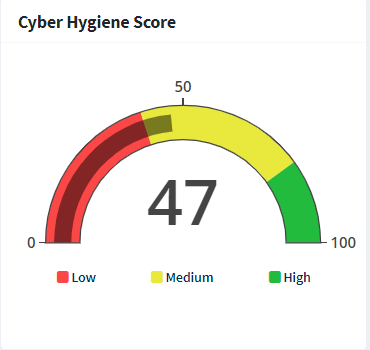
The Cyber Hygiene Score of the Organization is displayed to the right of the page. The Organization score is the weighted average of all the Accounts within the Organization. Clicking the metered icon takes you to the CHS Organization dashboard. Similarly, on an Account-level CHS dashboard, the account-specific CHS Score is displayed to the right of the page.
Detection
The Detection section categorizes the information provided by the SanerNow tools you subscribed to. The data is classified as follows:
- Category
- Risks
- Severity
- Trend
- Affected Devices
- Launch
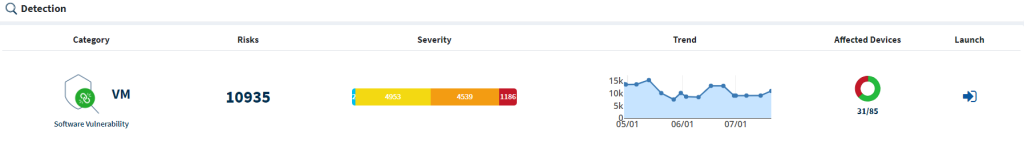
The Detection section in an Org level dashboard displays the below-mentioned information.
Category – This section lists the name of the SanerNow tools the Organization has subscribed to.
Risks – This section lists the total risks found by the respective SanerNow tool in the Organization.
Severity – This section categorizes the risks found into Low, Medium, High, and Critical categories based on severity.
Trend – This section shows the risks found over the past 90 days in a trending graph.
Affected Devices – This section categorizes the total devices in the Organization into affected and unaffected.
Launch – This section contains the launch icon. Clicking this icon takes you to the Account-specific Unified Dashboard.
For instance, if you’ve subscribed to the SanerNow VM tool, the Unified Dashboard will display all the vulnerabilities found in each of the Accounts present in the Organization.
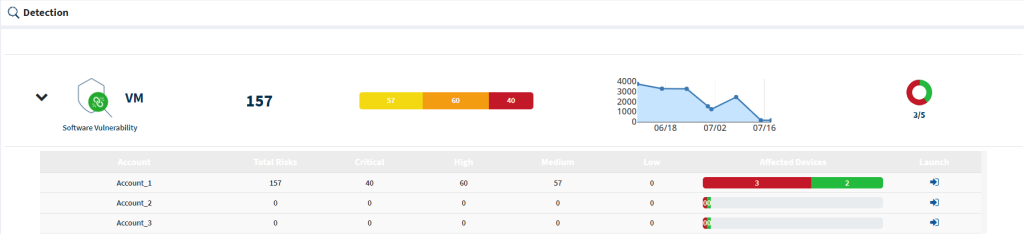
The VM section table displays the following information Account-wise.
- Account – This column displays the name of the Account present in the Organization.
- Total Risks – This column displays each Account’s total number of vulnerabilities.
- Critical – This column displays each Account’s total number of vulnerabilities under the Critical category.
- High – This column displays each Account’s total number of vulnerabilities under the High category.
- Medium – This column displays each Account’s total number of vulnerabilities under the Medium category.
- Low – This column displays each Account’s total number of vulnerabilities under the Low category.
- Affected Devices – This column displays the count of devices affected by the vulnerability in red. At the same time, the unaffected devices are shown in green.
- Launch – Clicking the launch icon
 takes you to the Unified Dashboard for the respective Account.
Similarly, other SanerNow tools, namely CM, PA, and PM, will appear in the Detection section, displaying misconfigurations, posture anomalies, and missing patches information detected in the Organization.
The number of SanerNow tools that appear in the Detection section will vary depending on your Organization’s subscription. |
The Detection section in an Account level dashboard displays the same above information, but the scope remains confined to the Accounts within the Organization. For instance, clicking the Launch icon next to VM will take you to the dashboard for that particular Account.
On the Account level Unified Dashboard, the Detection section will show all the SanerNow tools assigned to the Account by the Org Admin. |
Prioritization
The Prioritization section contains two sections: Prioritized Risks funnel and Factors Influencing Risk Prioritization chart. The Prioritization section remains the same for Organization and Account level Unified dashboards but will display Organization-specific information on an Organization level dashboard. And for an Account level dashboard, the information specific to the Accounts within the Organization is shown.
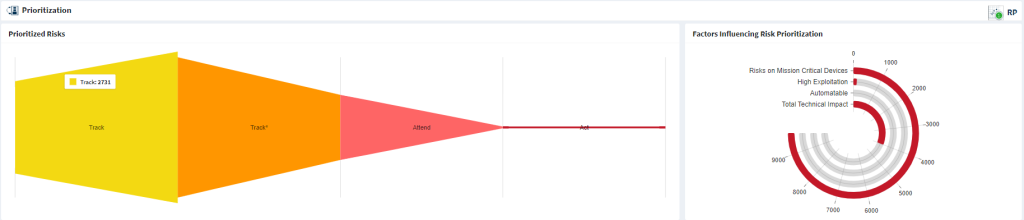
Prioritized Risks
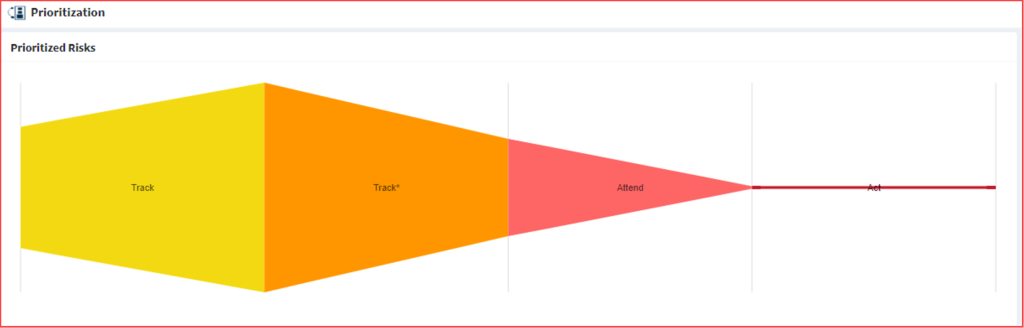
The Prioritized Risks funnel categorizes the risks found in your Organization as follows.
- Track
- Track*
- Attend
- Act
Track – The risks under this category don’t require action now. You can continue to track and reassess the risks if new information becomes available – remediate Track risks within standard update timelines.
Track* – The risks under this category contain specific characteristics that may require closer monitoring for changes. Security teams must closely monitor these risks to track any new developments in this case – remediate Track* risks within standard update timelines.
Attend – The risks under this category require attention from the Organization’s internal, supervisory-level individuals – remediate Attend risks within standard update timelines.
Act – The risks under this category require attention from the Organization’s internal, supervisory-level individuals – remediate Act risks as soon as possible.
Factors Influencing Risk Prioritization
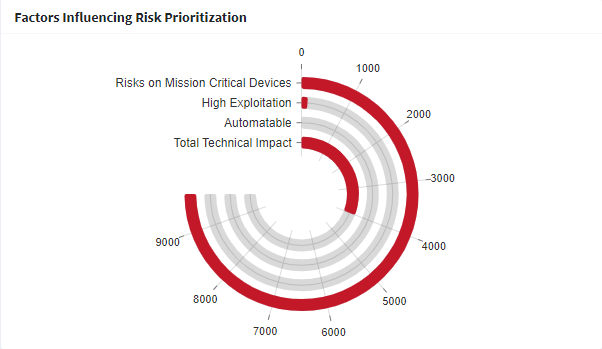
The Factors Influencing Risk Prioritization chart categorizes the risks found in the Organization into the following categories.
- Risk on Mission Critical Devices
- High Exploitation
- Automatable
- Total Technical Impact
Risk on Mission Critical Devices – The risks under this category exists on critical devices and must be immediately acted upon.
High Exploitation – The risks under this category can be easily exploited by bad actors.
Automatable – The risks under this category can be automated by bad actors to exploit the devices in the Organization.
Total Technical Impact – The risks under this category give bad actors total control over the behavior of the software or provide complete disclosure of all information on the systems.
 Note NoteOn an Organization level dashboard, the Prioritization section will appear if your Organization has subscribed to the SanerNow Risk Prioritization tool. Similarly, at an Account level, SanerNow Risk Prioritization should be enabled for the Prioritization section to be visible on the Account level Unified Dashboard. |
Remediation
The Remediation section contains two sections: Recommended Remediation for ACT Category and Remediation Actions.
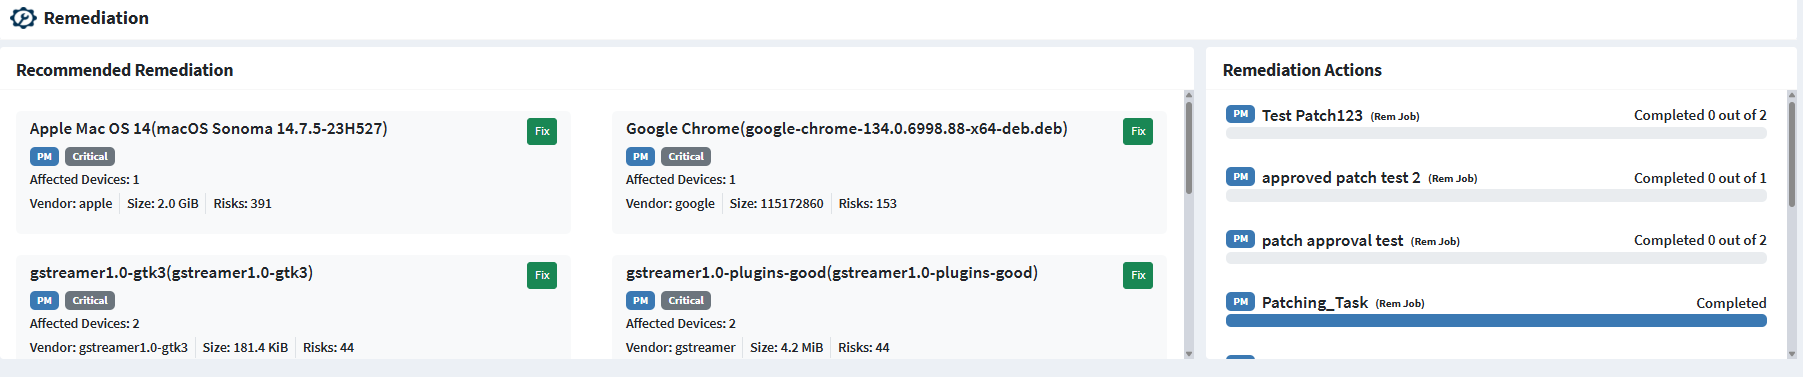
Recommended Remediation
This section displays the risks that you need to remediate immediately.
| Note The Recommended Remediation will work only if SanerNow Risk Prioritization is enabled at an Organization and Account level. |
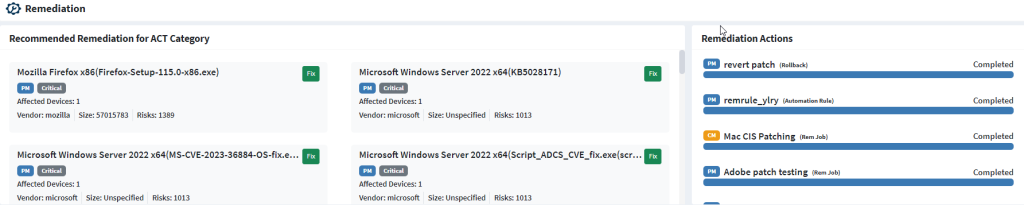
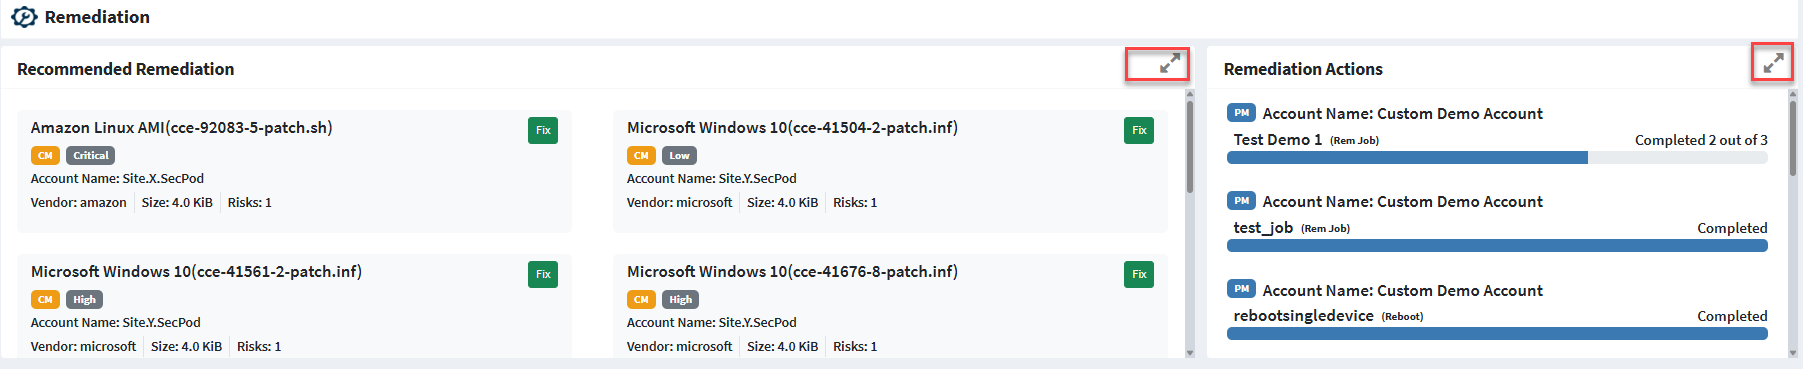
The Remediation section in an Organization level Unified Dashboard with SanerNow Risk Prioritization looks similar to the screenshot below.
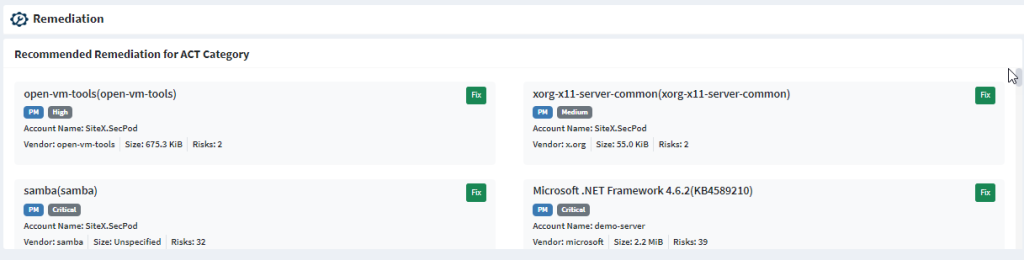
The following information about each Remediation on an Organization level Unified Dashboard is shown.
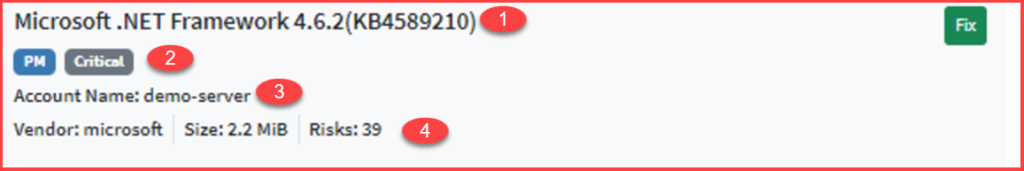
- The name of the vulnerable asset with relevant patch information.
- The name of the SanerNow tool used for remediation and the severity of the risk
- The name of the Account where the vulnerable asset exists.
- The name of the vendor providing the patch, its size, and the number of risks that will get remediated by applying the patch.
You can remediate the risks by clicking the Fix button. A pop-up window appears on the screen.
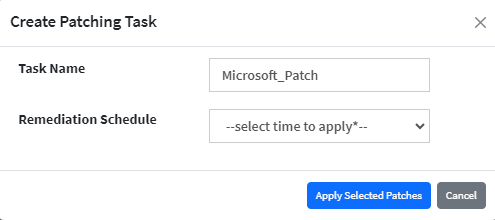
Fill in the task name and select a remediation schedule. You can choose the following scheduling options.
- Immediate
- After Scheduled Scan
- Custom date
Immediate – When you select the schedule as Immediate, the patch gets applied immediately.
After Scheduled Scan – When you select the schedule as After Scheduled Scan, the patch gets applied after SanerNow Agent performs the scheduled scan on the Account.
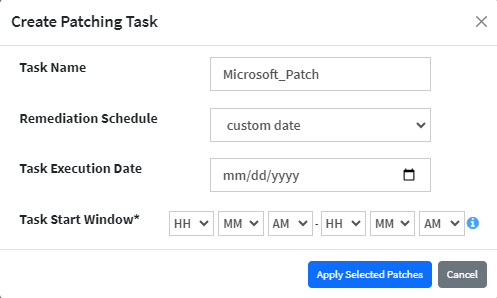
Custom Date – When you select the schedule as Custom Date, you need to specify the Task Execution Date and the Task Start Window.
(Task start window is a time frame during which a task is allowed to start running. For example, a task might have a start window of 09:00 PM to 11:00 PM, which means the task can begin anytime within that time range. If the device is offline during the start time window, the Task is not executed and gets reported as Schedule Missed.)
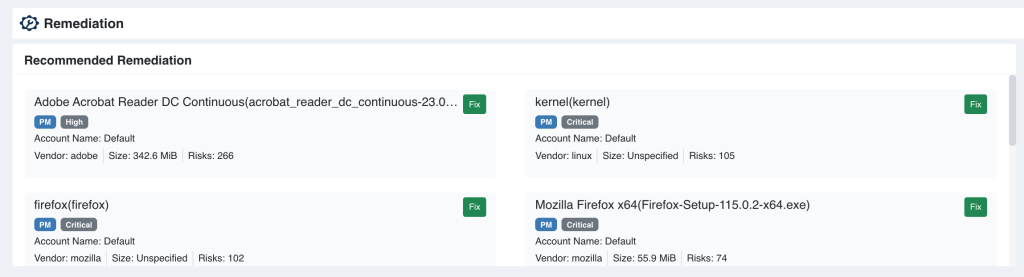
Similarly, on an Account level Unified Dashboard, the Remediation section with SanerNow Risk Prioritization enabled looks like this.
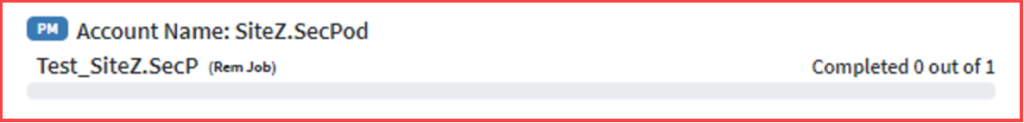
The following information about each Remediation on an Account level Unified Dashboard is shown.
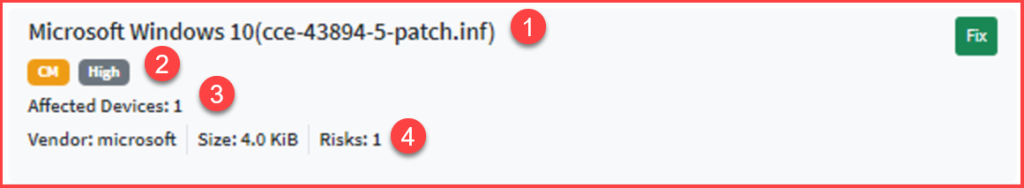
- The name of the vulnerable asset with relevant patch information.
- The name of the SanerNow tool used for remediation and the severity of the risk
- Number of devices affected in the Account by the risk
- The name of the vendor providing the patch, its size, and the number of risks that will get remediated by applying the patch.
You can remediate the risks by clicking the Fix button, which takes you to the Account-specific dashboard for the SanerNow tool.
However, if Risk Prioritization is not enabled, the top 10 recommended remediations from SanerNow PM and CM tool are displayed.
| Note If Risk Prioritization is not enabled for the Account, the remediation tasks listed under Recommended Remediation depend on the following conditions. a. If both SanerNow PM and CM tools are enabled, the top 10 recommended remediation tasks from SanerNow PM and CM tools get listed under Recommended Remediation section. b. If just the SanerNow PM tool is enabled for the Account, then the top 10 recommended remediation tasks from the SanerNow PM tool are listed under the Recommended Remediation section. c. If just the SanerNow CM tool is enabled for the Account, then the top 10 recommended remediation tasks from the SanerNow CM tool are listed under the Recommended Remediation section. Similarly, the last ten remediation Actions performed in the Account gets listed under the Remediation Actions section. |
Remediation Actions
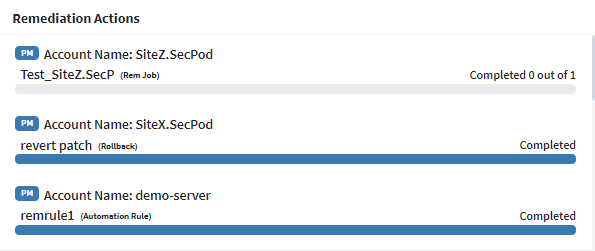
The Remediation Actions section displays all the remediation actions performed on the Accounts present in the Organization. You can see the Status of the Remediation Action – whether it is completed or is in the process of getting completed.
The following information about each remediation task listed under the Remediation Actions section is presented from left to right.
- The name of the SanerNow tool used to perform the Remediation Action.
- The name of the Account on which the remediation action was performed.
- The task name that was given to the remediation action.
- The status of the remediation action.
Similar information at an Account level is shown for the Remediation Actions section in the Account level Unified Dashboard.
The organization-level Saner Unified Dashboard lets you create remediation jobs for missing patches and misconfigurations for assets that belong to different accounts but belong to the same organization without accessing individual accounts pages.
Saner Org-level Unified Dashboard lists all the missing patches and misconfigurations from various accounts that belong to the same organization on a single page.
Performing Organization-Level Remediation
Viewing Missing Patches and Misconfigurations
Click the ![]() icon on the top of the Remediation section to access the Remediations page.
icon on the top of the Remediation section to access the Remediations page.
The Remediations page lists all the Missing Patches and Misconfigurations for all the accounts part of the selected organization.
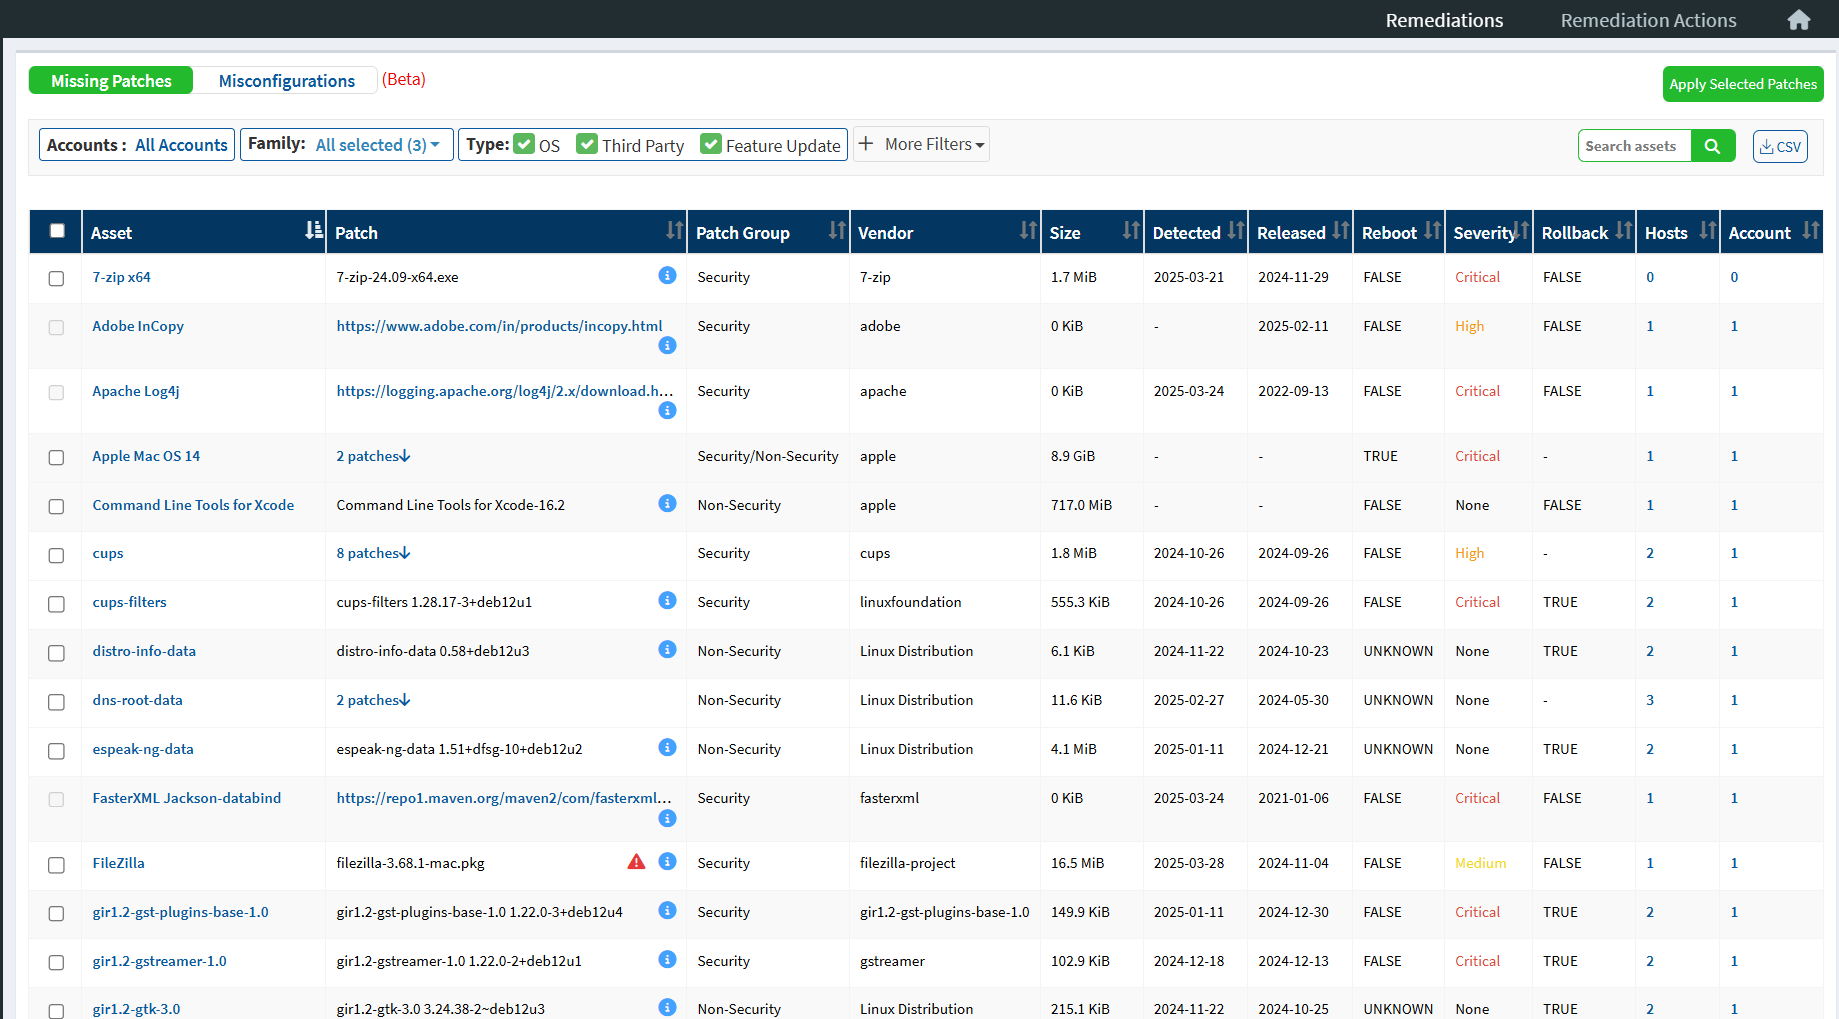
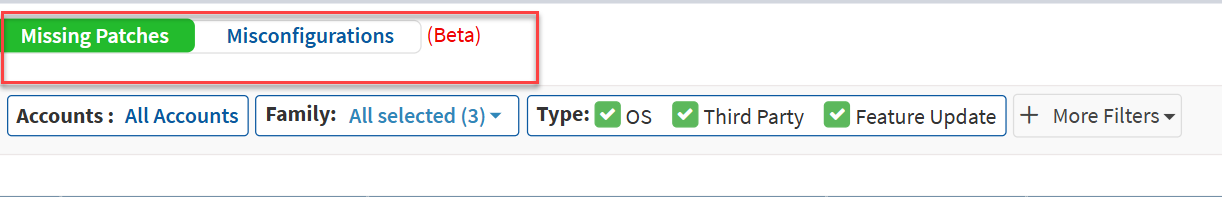
On the top left of the Remediations page, you can choose between Missing Patches and Misconfigurations.
The Remediations page has multiple filters that allow you to filter missing patches and misconfigurations. The available filters are as follows:
- Accounts
- Family
- Type
- More Filters
The Accounts filter allows you to select the account(s) and view missing patches and misconfigurations for the selected account(s).
The Family filter lets you view missing patches and misconfigurations depending on the operating system. You can choose between Windows, Unix, and Mac.
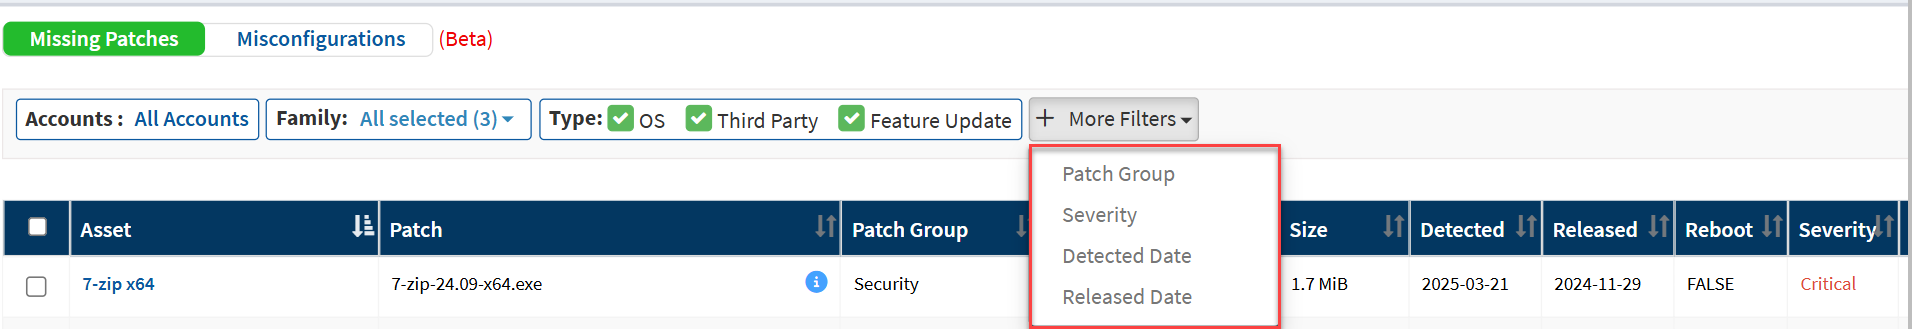
The Type filter allows you to choose between OS, Third Party, and Feature Update patches from the missing patches listed on the Remediations page.
Besides the OS, Third Party, and Feature Update filters, additional filters exist in More Filters. They are as follows:
- Patch Group
- Severity
- Detected Date
- Released Date
| Note The filters, namely OS, Third Party, Feature Update, and Patch Group, are available only for missing patches and not misconfigurations. |
The Patch Group filter allows you to choose between Security and Non-Security patches.
The Severity filter allows you to filter missing patches and misconfigurations depending on the severity level of each patch/misconfiguration. You can choose from the following severity values.
- Critical
- High
- Medium
- Low
- None
The Detection Date filter allows you to filter missing patches and misconfigurations based on the date Saner CVEM detected the missing patches and misconfigurations.
The Released Date filter allows you to filter patches and misconfigurations based on the date the vendor released the patches.
Saner Unified Dashboard lists all the missing patches and misconfigurations in a tabular format, providing detailed information about each patch.
| Field | Description |
| Asset | The name of the asset is displayed in the Asset column. |
| Patch | The missing patch file details are shown in the Patch column. If the patch details are unavailable, the link to the vendor’s site where the patch is available is displayed. |
| Patch Group | The Patch Group column displays two values- Security and Non-Security. If it is a security patch, it is shown as Security. If it is a non-security patch, it is shown as Non-Security. |
| Vendor | The vendor who provided the missing patch for the asset is shown under the Vendor column. |
| Size | The size of the missing patch file is shown under the Size column. |
| Detected | The date Saner CVWM detected the missing patch is shown under the Detected column. |
| Released | The date the vendor released the missing patch is shown under the Released column. |
| Reboot | The Reboot column displays two values- True and False. If the machine requires a reboot after applying the patch, it is shown as True. If a reboot is not required, it is shown as False. |
| Severity | The Severity column shows the severity of the patch. It can be Critical, High, Medium, Low, and None. |
| Rollback | The Rollback column displays two values- True and False. If the patch can be rolled back after installation, it is shown as True. Otherwise, it is displayed as False. |
| Hosts | The Hosts column displays the number of devices on which the missing patch needs installation. |
| Account | The Account column displays the number of accounts with assets requiring patching. |
You can search for assets by entering the name in the Search assets search box next to the ![]() icon. Also, you can download the missing patches information into a CSV file by clicking the
icon. Also, you can download the missing patches information into a CSV file by clicking the![]() CSV icon.
CSV icon.
Creating a Remediation Job for Missing Patches and Misconfigurations
Creating a remediation job for Missing Patches
The Remediations page lists all the assets and their missing patches in a tabular format.
1. Click the checkbox next to the assets to which you want to apply the missing patches.
2. Click the Apply Selected Patches button.
The Create Patching Task window appears.
The Task Impact pane displays the following information.
- The total number of patches selected as part of the patching task.
- The total number of devices on which the patches are getting deployed.
- The total number of accounts to which selected devices for patching belong.
The Task Controls pane on the Creating Patching Task window lets you specify additional controls for a patching task.
- Reboot Control: You can specify a reboot schedule for the patching task. You can select from the below options.
- Do not reboot
- Reboot automatically
- Force reboot
- Schedule date and time
- Remediation End Time: You can specify the time frame for completing the patching task.
- Patching Notification: You can specify a notification message before the patching activity begins. And a notification message when the patching activity ends.
3. Provide the following mandatory inputs to create a patching task. They are as follows:
- Task Name — You must provide the name of the selected patching task.
- Remediation Schedule –- You can choose when you want SanerNow to apply the patches. SanerNow supports the below remediation schedule.
- Immediate — When you select the remediation schedule as Immediate, the patches are applied immediately.
- After scheduled scan — When you select the remediation schedule as After scheduled scan, the patches are applied once the Saner Agent completes the scheduled scan.
- Custom date — When you select the remediation schedule as custom date, you must specify the date and the time frame during which you want Saner to apply the patches.
4. Click the Apply Selected Patches button. Saner creates the patching task.
Creating a remediation job for Misconfigurations
The Remediations page lists all the assets and their misconfiguration patches in a tabular format.
1. Click the checkbox next to the assets to which you want to apply the misconfiguration patches.
2. Click the Apply Selected Patches button.
The Create Patching Task window appears.
The Task Impact pane displays the following information.
- The total number of misconfiguration patches selected as part of the patching task.
- The total number of devices on which the patches are getting deployed.
- The total number of accounts to which selected devices for patching belong.
The Task Controls pane on the Creating Patching Task window lets you specify additional controls for a patching task.
- Reboot Control: You can specify a reboot schedule for the patching task. You can select from the below options.
- Do not reboot
- Reboot automatically
- Force reboot
- Schedule date and time
- Remediation End Time: You can specify the time frame for completing the patching task.
- Patching Notification: You can specify a notification message before the patching activity begins. And a notification message when the patching activity ends.
3. Provide the following mandatory inputs to create a patching task. They are as follows:
- Task Name — You must provide the name of the selected patching task.
- Remediation Schedule –- You can choose when you want SanerNow to apply the patches. SanerNow supports the below remediation schedule.
- Immediate — When you select the remediation schedule as Immediate, the patches are applied immediately.
- After scheduled scan — When you select the remediation schedule as After scheduled scan, the patches are applied once the Saner Agent completes the scheduled scan.
- Custom date — When you select the remediation schedule as custom date, you must specify the date and the time frame during which you want Saner to apply the patches.
4. Click the Apply Selected Patches button.
Saner creates the patching task.
Viewing Remediation Job Status
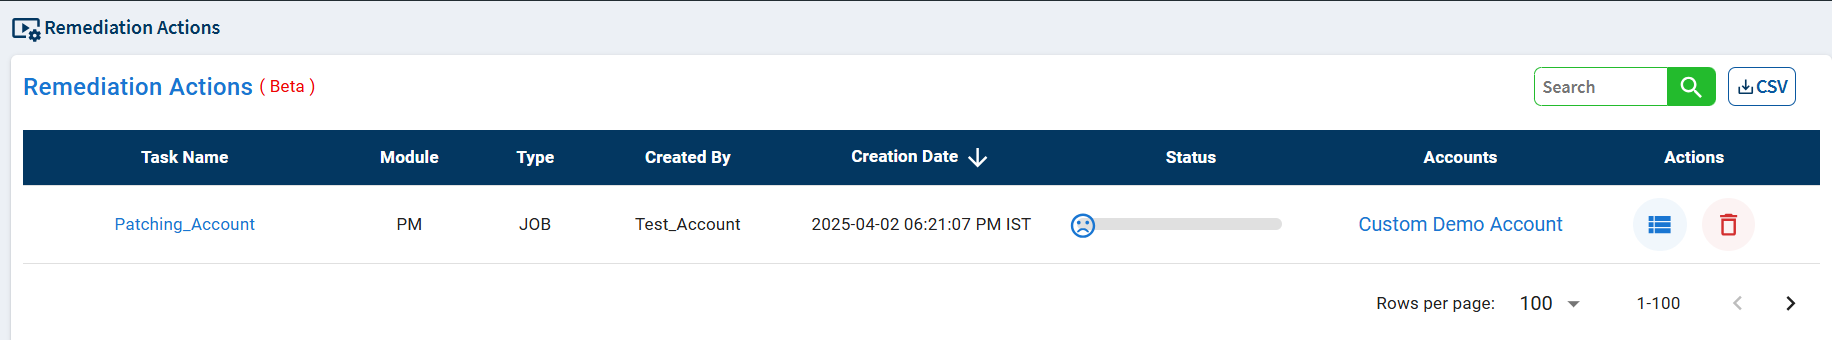
The Remediation Actions page lists all the patching tasks and their statuses in a tabular format, providing detailed information about each patching task.
| Field | Description |
| Task Name | The name given to the patching task is displayed in the Task Name column. |
| Module | The Saner module name to which the created patching task belongs is displayed in the Module column. |
| Type | The patching job’s type is displayed in the Type column. |
| Created By | The user who created the patching task is displayed in the Created By column. |
| Creation Date | The date on which the patching task was created is displayed in the Creation Date column. |
| Status | The status of the patching task is displayed in the Status column. If the patch task is currently under progress, it is displayed as Ongoing. If the patching task is completed, it is displayed as Completed. |
| Accounts | The account(s) to which the devices on which the missing patches/misconfigurations were applied belonged is shown under the Accounts column. |
| Actions | In the Actions column, you can view the overall patching task status. Also, you can delete a completed patching task. |
You can search for patching tasks by entering the name in the search box next to the ![]() icon. Also, you can download the missing patches information into a CSV file by clicking the
icon. Also, you can download the missing patches information into a CSV file by clicking the![]() CSV icon.
CSV icon.
Viewing Remediation Task Status
You can view detailed information about the remediation tasks on the Remediation Actions page.
Clicking the ![]() icon takes you to the Task Status page, where you can view the overall status for each the patching task presented in a tabular format.
icon takes you to the Task Status page, where you can view the overall status for each the patching task presented in a tabular format.
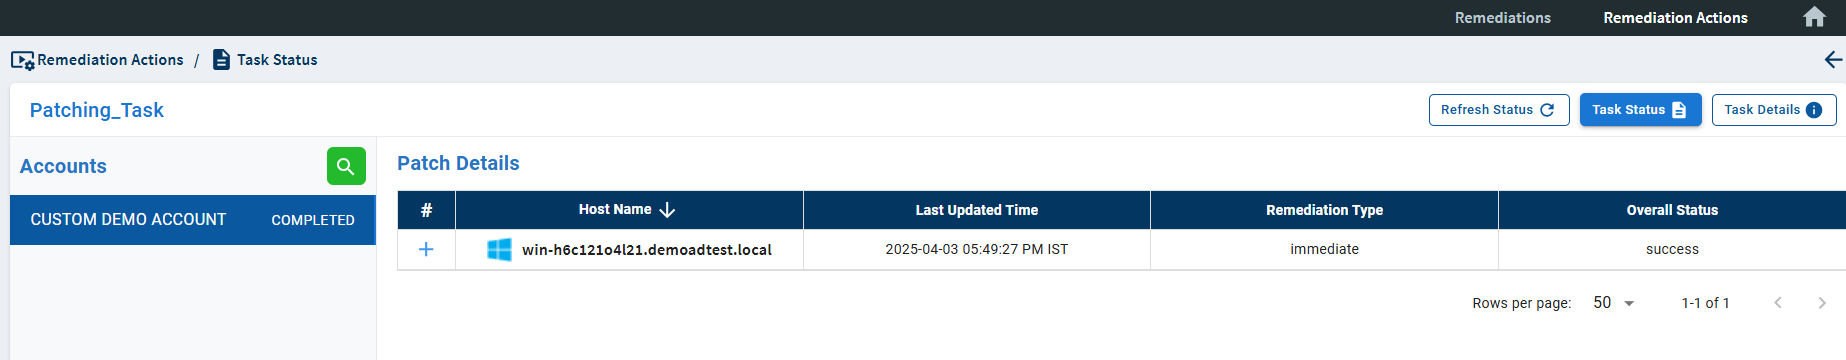
| Field | Description |
| Host Name | The name of the host on which the patching task is getting performed is displayed in the Host Name column. |
| Last Updated Time | The date and time Saner Agent performed activity on the device is displayed in the Last Updated Time column |
| Remediation Type | The remediation schedule selected for the patching task is displayed in the Remediation Type column. |
| Overall Status | The final status of the patching task is displayed in the Overall Status column. |
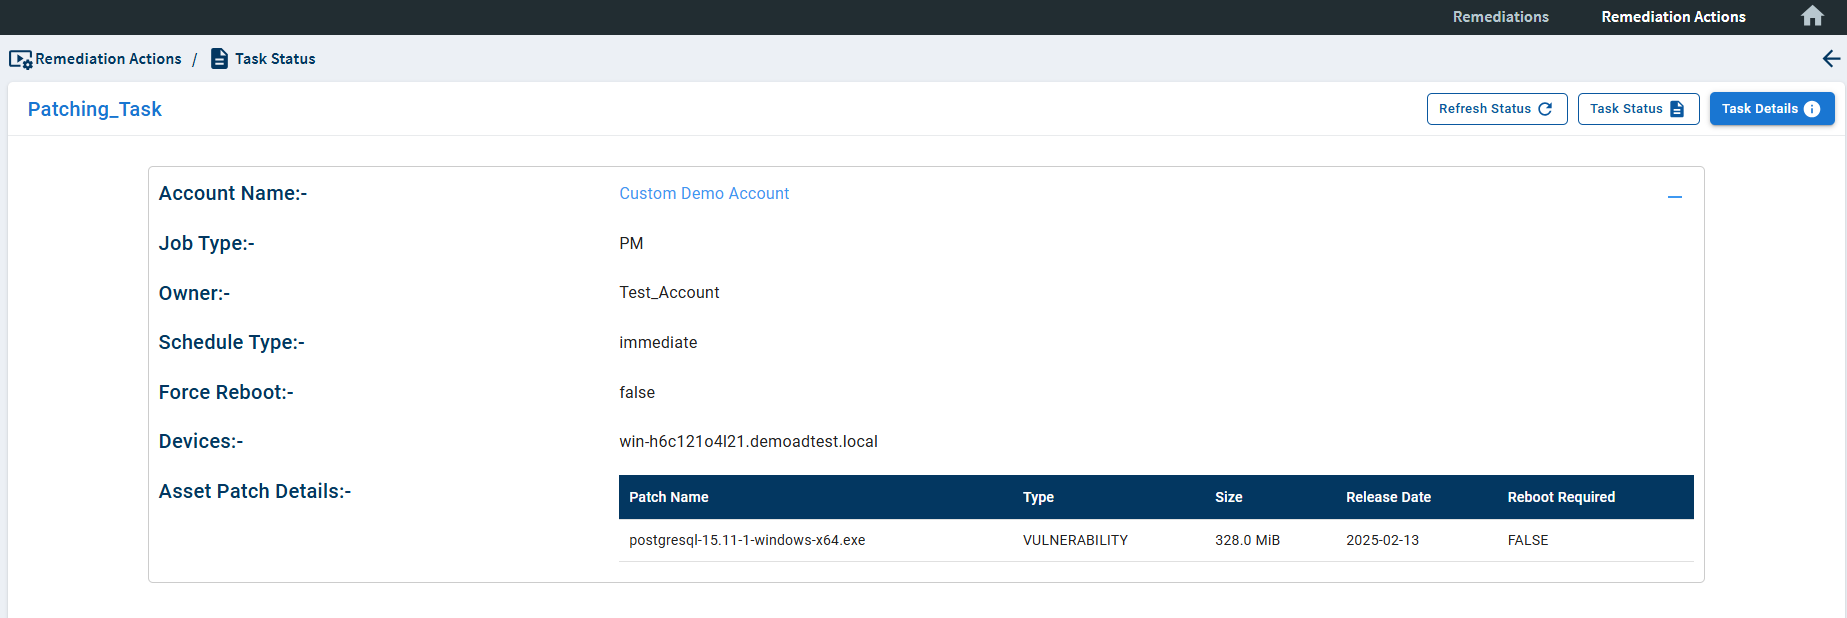
The Task Details page provides detailed information about the patching task. The below details are presented on the Task Details page.
| Field | Description |
| Account Name | The account to which the device belongs on which the patching task is being carried out is displayed in the Account Name column. |
| Job Type | The job type, whether it’s a PM or CM job, is displayed in the Job Type column. |
| Owner | The name of the user who created the patching task is displayed in the Owner column. |
| Schedule Type | The type of schedule specified for the patching task is displayed in the Schedule Type column. |
| Force Reboot | If the device requires a force reboot as part of the patching task, the Force Reboot column displays True. If a force reboot is needed, it displays as False. |
| Devices | The device’s hostname on which the patching task is being carried out is displayed in the Devices column. |
| Asset Patch Details | The details of the patch being applied as part of the remediation job is displayed in the Patch Details column. |

