Overview
The Saner Cyber Hygiene Score is a new feature that assigns a security score to organizations, accounts, and devices in the Saner ecosystem.
Cyber hygiene refers to the practices an organization follows to protect its network, assets, and users from cyberattacks.
The Cyber Hygiene Score quantifies the overall attack surface of a device. It takes into account Common Vulnerabilities and Exposures (CVEs), Common Configuration Enumerations (CCEs), missing patches, and posture anomalies.
The score provides a clear view of your organization’s security posture. It helps you identify areas that need attention and take informed steps to improve device and network security.
Types of Scores in CHS
Raw Score
Saner computes the raw score by giving an equal weightage of 25% each to CVEs, CCEs, Missing Patches, and Posture Anomalies, leading to four subscores being computed. A raw score is the sum of the four subscores and can be customized. The higher the raw score of a device, the less secure it is.
Global Score
Global score is a normalized raw score that ranges from 0-100. The higher the global score a device has, the more secure it is. Each Account in an Organization has a different score, and we can compare the Global Score of a device from one Account to another device from another Account.
Local Score
The Local score is computed as another normalized raw score that indicates where the device stands in an Account. The safest device in an Account will score 100, while the least safe device gets a 0. The main intention behind computing Local Score is to find the best device in the Account. You can compare the Local Score of machines within the Account.
Cyber Hygiene Score
The Cyber Hygiene Score of a device is the weighted average of a device’s Global Score and Local Score. The default weightage of 80% Global Score and 20% Local Score is considered during the computation of the Cyber Hygiene Score.
Patched Account Score
The Patched Account Score is an ideal account score for an Account. It is achieved when all the missing patches are applied, vulnerabilities patched, and Posture Anomalies and CCEs remediated. The Patched Risk Score is an ideal Risk Score that every Account should strive to achieve by leveraging various Saner tools. However, while calculating the Patched Account Score, we consider that you’ve been getting vulnerabilities and misconfigurations and will continue to get vulnerabilities in the future. Saner’s Machine Learning algorithm computes the Patched Account Score by training how your score has been in the past and how it might be in the future.
Account Score
The Account Score is the average of the Risk Score of the devices in an Account.
Organization Score
The Organization Score is the weighted average of the scores of all the Accounts under the Organization. At the same time, while computing the Organization Score, the number of devices in the Account is the weight.
Pre-requisites for CHS
CHS is available to all Saner subscribers. However, you must subscribe to at least one of the following Saner tools to compute the CHS Score.
- Saner VM
- Saner PM
- Saner CM
- Saner PA
Get Started with CHS
Login to the Saner web console and access the Unified Dashboard. Click on the score meter icon on the top right of the page. You will be redirected to the CHS Organization Dashboard.
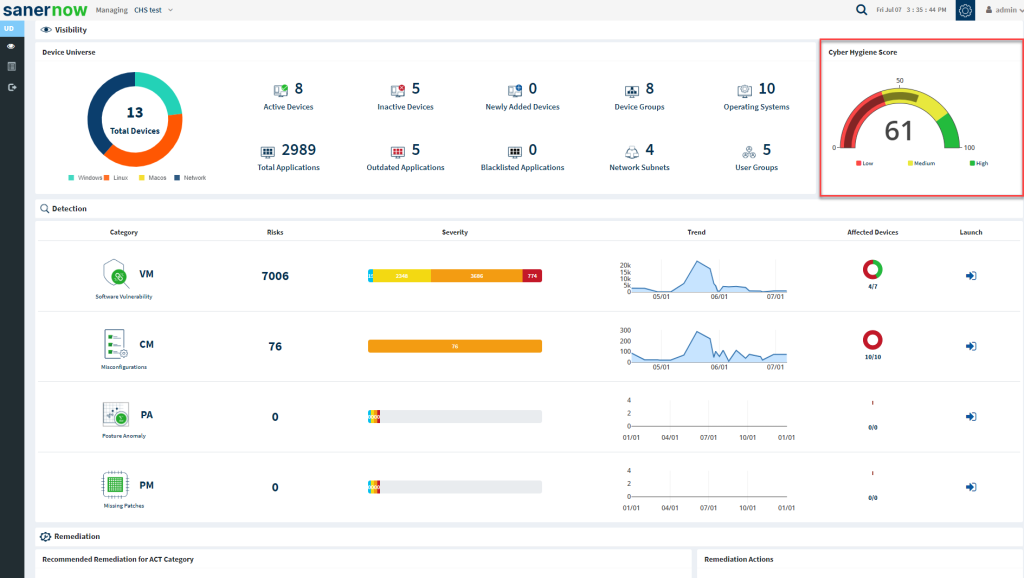
Login to the Saner web console and access the Unified Dashboard. Click on the score meter icon on the top right of the page. You will be redirected to the CHS Organization Dashboard.
CHS Organization Dashboard
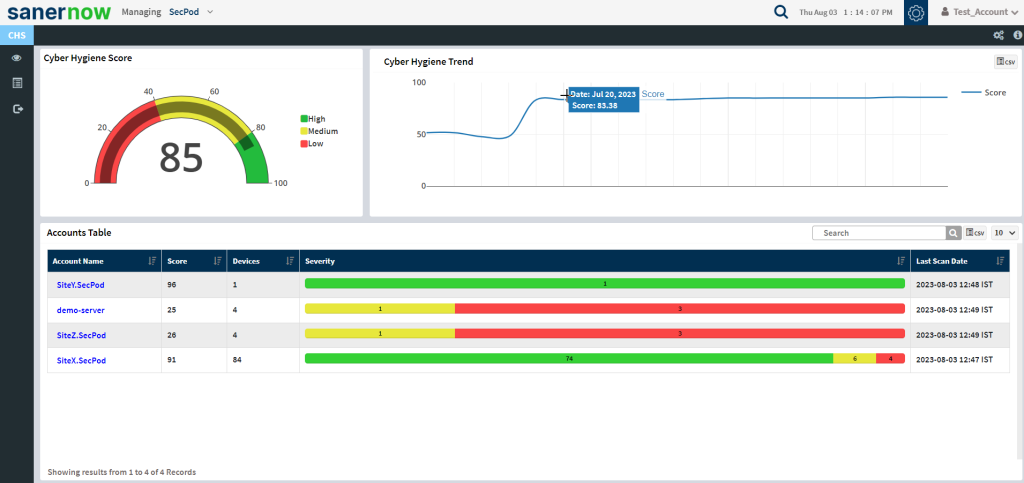
CHS Organization Dashboard gives detailed information about the Accounts that belong to the Organization you selected. Let’s look at each of these grids and the information provided by them.
Cyber Hygiene Score
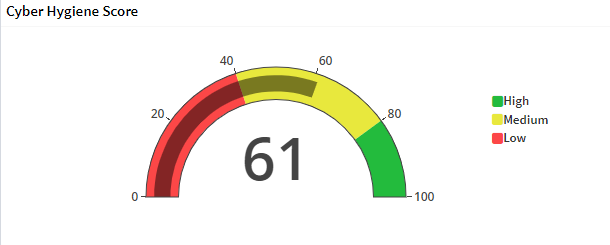
The Cyber Hygiene Score grid displays the CHS Score for the Organization. It is the weighted average of the scores of all the Accounts in an Organization to which the user has access. CHS Score is categorized into the following levels:
| CHS Score Category | Range | Color Code |
| Low | 0 – 39 | Red |
| Medium | 40 – 79 | Yellow |
| High | 80 – 100 | Green |
You can refer to the Types of Scores in CHS section to learn more about how scores are computed.

Cyber Hygiene Trend
The Cyber Hygiene Trend graph visually represents the change in Organization score over 30 days. You can download the Cyber Hygiene Trend report in a CSV format. Click on the icon on the top right of the Cyber Hygiene Trend grid. A pop-up message will appear, asking you to confirm the location where you want the file to be saved.
Accounts Table

Accounts Table displays the following information.
- Account Name – This column displays all the Accounts part of the selected Organization.
- Score – This column displays the CHS Score for individual Accounts.
- Devices – This column shows the total number of devices in an Account.
- Severity – This column shows the severity category for the devices
- Last Scan Date – This column displays the date and time of the most recent CHS Scan done on the Account.
You can download the information presented in the Accounts table in a CSV format. Click the ![]() icon to download and save the file on your machine.
icon to download and save the file on your machine.
Configure Weightage
Each module, namely Vulnerabilities, Misconfigurations, Missing Patches, and Posture Anomalies contributes to your sub-score. Depending on your IT infrastructure requirements, you can prioritize how much each module will contribute to your subscore. You can configure the weightage for the Accounts in the Organization. You can do it manually or use the Auto-adjust feature.
Click the gear icon ![]() on the right side of the CHS homepage. A pop-up window appears, allowing you to enter the weightage manually. However, ensure that the total sum of the weightages doesn’t exceed 100.
on the right side of the CHS homepage. A pop-up window appears, allowing you to enter the weightage manually. However, ensure that the total sum of the weightages doesn’t exceed 100.
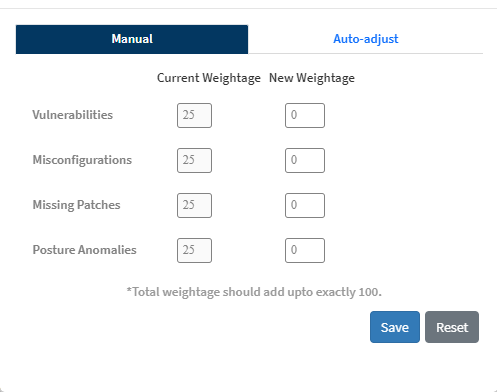
Also, you can use the Auto-adjust feature to configure the weightage for the Accounts. Auto-adjust feature allows you to set the weightage by using the slider.
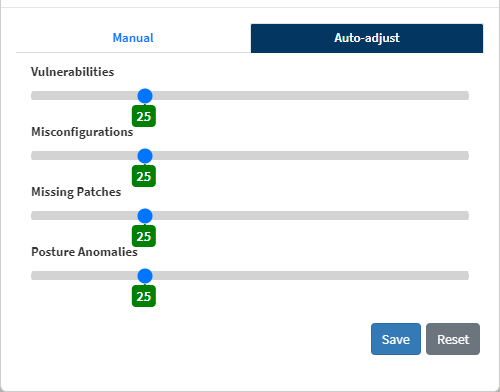
Click the Save button to save the newly specified weightages.
| Note You can configure weightages for individual Accounts. However, you can also configure weightages for all the Accounts in an Organization by checking the Select All checkbox. |
Navigation Help
Saner CHS has built-in Navigation help. Click on the icon to access the navigation help.
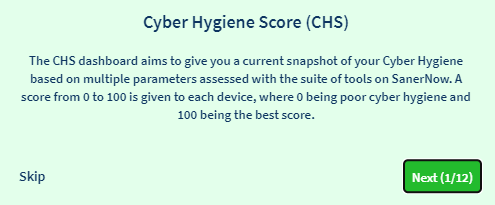
Click the Next button to navigate to the next slide. The navigation help gives you a brief tour of the CHS Organization dashboard.
CHS Account Dashboard
CHS Account Dashboard provides detailed information about the devices in the Account. Let’s take a look at each of the grids and the information provided by them.
Cyber Hygiene Score
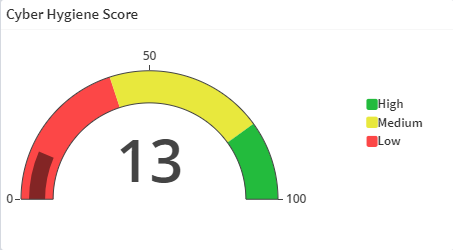
The Cyber Hygiene Score grid displays the CHS Score for the Account. A metered graph represents the latest overall cyber hygiene score of the Account. CHS Score is categorized into the following levels:
| CHS Score Category | Range | Color Code |
| High | 0 – 39 | Green |
| Medium | 40 – 79 | Yellow |
| Low | 80 – 100 | Red |
Contributors
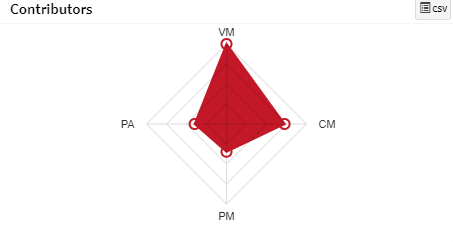
The Contributors grid displays the contribution of each of the four Saner CVEM modules (VM, PM, CM, and PA) towards the CHS Score of the Account. You get a clear view of the factors – CVEs, CCEs, Missing Patches, and PAs that are bringing down the CHS score of the Account.
You can download the information presented in the Contributors graph in a CSV format. Click on the icon to download and save the file on your machine.
Cyber Hygiene Trend

The Cyber Hygiene Trend graph shows the trend in the Cyber Hygiene Score over the past 30 days. The trending graph gives a visual representation of change in score over time, helping the user to analyze the difference in the count of vulnerabilities and other risks that exist in an account. The CHS trending graph also helps to examine the impact of remediation actions performed on the Account.
Similarly, the Cyber Hygiene Trend graph shows the score prediction for the next day, assuming that the user undertakes all the recommended remediation actions against detected vulnerabilities and risks. The difference between the predicted and actual scores of an Account reflects the impact of remedial actions performed by the user.
You can download the information presented in the Cyber Hygiene Trend graph in a CSV format. Click on the icon to download and save the file on your machine.
Frequency Distribution of Devices by Score

The Frequency Distribution of Devices graph shows the number of devices that fall into each score band. Clicking on the number displayed on the Device tile provides the device’s hostname that falls into the particular score band.
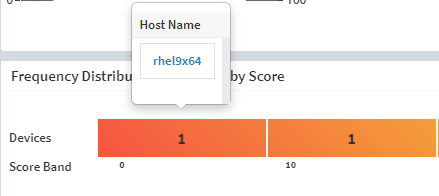
Clicking on the hostname takes you to the Device Details page. Here, you can find more information about the device.

The top section of the page displays the following details:
- Cyber Hygiene Score: CHS Score for the device will be displayed right below the display icon.
- Device Name: This field displays the host’s name detected during the network scan.
- Operating System: This field displays the name of the operating system detected running on the host during the network scan.
- Processor/Architecture: This field displays the type of processor installed on the system and the manufacturer of the processor.
- Total Number of Cores: This field displays the number of cores available on the processor.
- Installed Memory: This field displays the total memory available on the device.
- Primary Mac Address: This field displays the host’s mac address detected during the network scan by the Network Scanner.
- Primary IP Address: This field displays the IP Address assigned to the host.
- Group: This field displays the group to which the device belongs.
- Agent Version: This field displays the build version of the Saner Agent installed on the device.
- Last Scan: This field displays the date and time Network Scanner performed the last network scan on the host.
- Next Scan: This field displays the date and time during which the following network scan will be performed on the host by Network Scanner.
- Last Updated: This field displays the date and time the Saner Agent downloaded the security content from Saner CVEM Server.
- Next Update: This field displays the date and time the Saner Agent will download the security content from Saner CVEM Server.
- Last Remediated: This field displays the date and time patches were applied to the device.
- Status: This field displays whether the device is online /offline. And the ongoing scan status on the device.
- Export Device Report: This button downloads all the details about the host presented on the screen in a .pdf format.
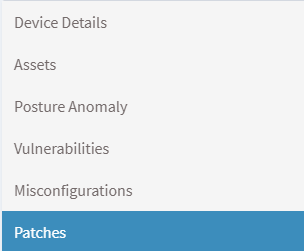
You will find six menu options on the left side of the Device Details page. They’re as
- Device Details
- Assets
- Posture Anomaly
- Vulnerabilities
- Misconfigurations
- Patches
Assets
This section displays all the software installed on the endpoint device with their relevant version number.
Vulnerabilities
This section displays all the vulnerabilities detected on the endpoint device.
Misconfigurations
This section displays all the Common Configuration Enumeration (CCE) IDs applicable to the endpoint device.
Patches
This section displays the Installed Patches on the endpoint. At the same time, information related to Missing Security Patches, Missing Non-Security Patches, and Firmware is also shown.
Devices with Cyber Hygiene Score

The Devices with Cyber Hygiene Score table gives a detailed account of all the devices present in the Account. Details shown in the table are as follows.
- Host Name – This column displays the hostname of the device.
- IP Address – This column displays the IP Address associated with the device.
- Operating System – This column displays the operating system installed on the device.
- Group – This column displays the group to which the device belongs.
- Family – This column displays the OS family to which the device belongs.
- Local Score – This column displays the local score of the device.
- Global Score – This column displays the global score of the device.
- Cyber Hygiene Score – This column displays the CHS Score of the device.
- Status – This column displays the device’s status – whether Active, Inactive, or in Reboot Needed state.
The data provided in the Devices with Cyber Hygiene Score table can be filtered using the below filters.
- Source
- OS
- Family
- Severity
- Status
You can download the information presented from the Devices with Cyber Hygiene Score table in a CSV format. Click the ![]() icon to download and save the file on your machine.
icon to download and save the file on your machine.
Top 5 Risk Exposures
The Top 5 Risk Exposures table lists the top 5 risks found in each category (Vulnerabilities, Misconfigurations, Missing Patches, and Posture Anomalies).
The Vulnerabilities tab displays the top 5 vulnerabilities found in the Account. Below-mentioned information shows up in the vulnerabilities table.
- ID – This column displays the CVE-ID associated with the vulnerability.
- Title – This column gives a brief description of the vulnerability.
- Asset – This column displays the number of Assets in the Account affected by the vulnerability.
- Hosts – This column displays the total number of hosts in the Account affected by the vulnerability.
- Detection Date – This column displays the date when the Saner VM detected the vulnerability in the Account.
- Release Date – This column shows the date the CVE was made public.
- Severity – This column displays the severity status of the vulnerability detected.
The Misconfigurations tab displays the top 5 misconfigurations found in the Account. Below-mentioned details show up in the misconfigurations.
- Risk ID – This column displays the CCE-ID associated with the misconfiguration.
- Title – This column gives a brief description of the misconfiguration.
- Asset – This column displays the number of Assets in the Account affected by the misconfiguration.
- Hosts – This column displays the total number of hosts in the Account affected by the misconfiguration.
- Detection Date – This column displays the date when Saner VM detected the misconfiguration in the Account.
- Release Date – This column displays the date when the misconfiguration was made publicly known.
- Severity – This column displays the severity status of the misconfiguration detected.
The Missing Patches tab displays the top 5 missing patches in the Account. Below-mentioned details show up in the missing patches table.
- Assets – This column displays the assets that need immediate patching.
- Patch – This column displays the link from where the patch can be downloaded.
- Vendor – This column displays the name of the vendor who released the patch for the asset.
- Detection Date – This column displays the date when Saner PM detected the missing patch for the Asset.
- Release Date – This column displays the date when the vendor released the patch.
- Reboot Status – This column displays whether a device reboot is needed after applying the patch.
- Severity – This column displays the severity status of the missing patches detected.
- Hosts – This column displays the total number of hosts with assets requiring immediate patching.
The Posture Anomalies tab displays the top 5 PAs found in the Account. The following details get displayed on the Posture Anomalies table.
- PA ID – This column displays the PA ID associated with the anomaly found in the Account.
- Title – This column briefly describes the anomaly found in the Account.
- Anomalies – This column displays the total number of anomalies relevant to the particular PA ID found in the Account.
- Confidence – This column displays the name of the vendor who released the patch for the asset.
- Hosts – This column displays the number of hosts affected by the particular anomaly.
- Detection Date – This column displays the date Saner detected the particular anomaly in the Account.


