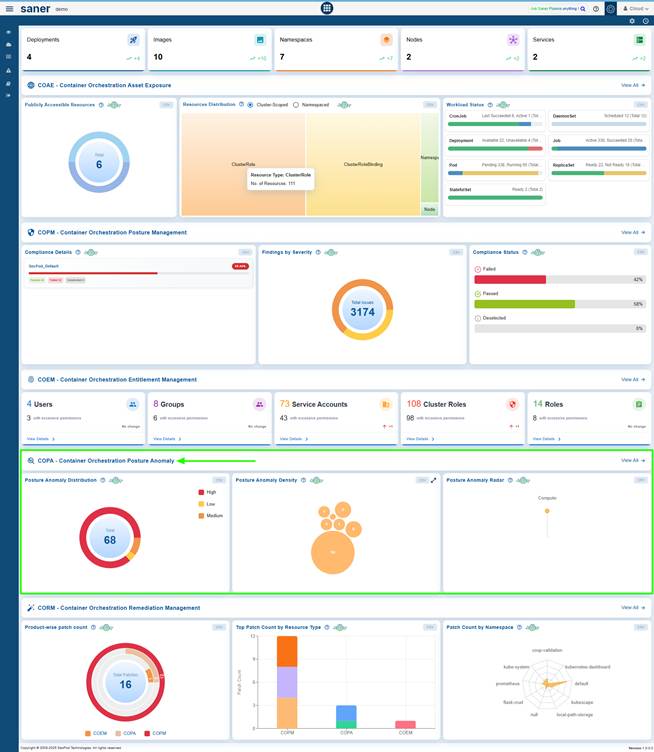
The Container Orchestration Posture Anomaly (COPA) tool offers a comprehensive framework to detect, analyze, and remediate configuration anomalies in Container and Kubernetes environments. It empowers security and operations teams to maintain a strong container posture by continuously monitoring both anomalous and non-anomalous behavior, identifying deviations, and facilitating swift corrective actions.
Users can analyze posture anomalies based on severity levels to understand the distribution of high, medium, and low-risk deviations. They can also assess resource impact through posture anomaly density, helping to identify areas with the highest concentration of issues. The module allows users to evaluate anomaly distribution across different categories and track trends over time, providing ongoing visibility into changes in posture.
For Kubernetes accounts, the module monitors both anomalous and non-anomalous behaviors to ensure effective management of detected deviations. Users can investigate anomalies at a granular level, exploring specific COPA IDs, completing remediation steps, and whitelisting COPA IDs when appropriate.
The Saner Container Orchestration Posture Anomaly(COPA) dashboard enables teams to analyze and investigate detected anomalies by tracking them by ID and title. Users can look at detailed insights, trace affected resource counts, and categorize issues. The system also allows users to prioritize remediation based on confidence levels, initiate patch remediation, and identify when each anomaly was detected.
Additionally, the module supports environment and cluster switching, providing a unified view across multiple contexts. With its combination of high-level visualization and in-depth analytical capabilities, the Container Orchestration Posture Anomaly module ensures that organizations can efficiently detect, understand, and resolve anomalies, ultimately strengthening their overall container security posture and operational resilience.
Get Started
In this chapter, you get started with understanding how to effectively use COPA to strengthen your container security posture and maintain compliance.
Begin by accessing the COPA tool from the platform, where you gain centralized visibility into all detected anomalies across your Kubernetes accounts. The dashboard enables you to analyze posture anomalies by severity level, allowing you to quickly prioritize critical risks that require immediate attention.
To better understand the impact of these anomalies, COPA provides insights into posture anomaly density, helping you assess how widely issues are distributed across your resources. You can further evaluate anomaly distribution across categories, giving clarity on the types of anomalies or risks affecting your environment.
COPA supports deep investigation by allowing you to analyze and investigate anomalies at a granular level. You can drill down into specific findings, review affected resources, and understand the root cause of each anomaly. For known or acceptable deviations, the platform enables you to whitelist COPA IDs, ensuring they are excluded from future alerts.
Once anomalies are identified, you can take action by initiating patch remediation directly from the platform. This helps in quickly resolving vulnerabilities and anomalies. Additionally, you can fix anomalies detected in your Kubernetes account through guided remediation workflows that streamline the resolution process.
To maintain continuous security improvement, COPA allows you to track anomaly trends over time, giving visibility into whether your remediation efforts are effective. By monitoring trends and patterns, you can proactively manage risks and prevent recurrence of issues.
Overall, COPA empowers organizations to detect, investigate, and remediate posture anomalies efficiently while maintaining strong governance and visibility across containerized environments.
Access the Container Orchestration Posture Anomaly (COPA) Tool
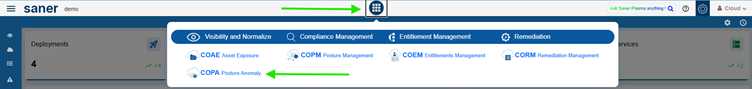
You can access the COPA Dashboard through 2 entry points: the overall COSP Dashboard or directly via the App Launcher.
EntryPoint 1: From the Overall COSP Dashboard
EntryPoint 2: From the App Launcher
Analyze Posture Anomalies by Severity Level
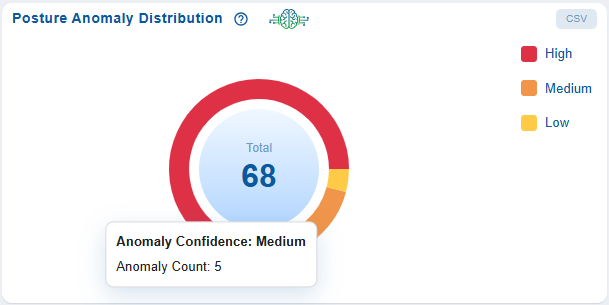
The pie chart represents the proportion of anomalies in each severity category. The severity levels of the detected anomalies are categorized into High (Red), Medium (Orange), and Low (Yellow). This helps you gain a quick understanding of the overall risk distribution within your container environment, assess the proportion of critical posture deviations, and focus attention on the ones that have the greatest impact.
Data Source and Scope
The data is derived from posture evaluation scans conducted across monitored assets and services, capturing anomalies identified through configured policies, benchmarks, and security rules. The scope of this data may vary depending on the selected container accounts or profiles, the services and resource types included, as well as the scan frequency and the most recent scan timestamp.
Analytical Insights
With the data-driven insights from the view, you can continuously improve and maintain your organization’s security posture
The analytical insights help evaluate the distribution of critical versus non-critical issues, identify the services or resources contributing to high-severity anomalies, monitor trends to assess if the overall risk posture is improving or deteriorating, and measure the effectiveness of remediation efforts over time.
As an example, the view can also prompt questions such as: Are most anomalies high, medium, or low in severity?, Which areas or systems are contributing the most to high-severity issues?, Is the overall risk level improving or worsening over time?, Should remediation efforts focus on reducing the number of high-impact anomalies first?.
Remediation Guidance
Remediation recommendation is to address anomalies based on severity: high-severity issues should be resolved first to mitigate immediate risks, medium-severity issues should be handled next to prevent escalation, and low-severity issues can be scheduled as part of routine maintenance.
Assess Resource Impact through Posture Anomaly Density
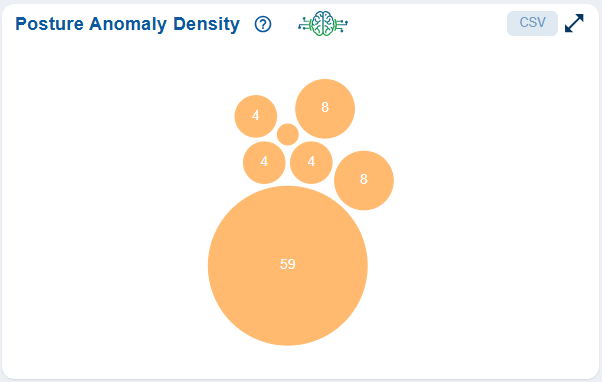
The Posture Anomaly Density view helps visualize the concentration of anomalies across various resources using a bubble chart. Each bubble corresponds to the number of affected resources, allowing you to quickly assess which areas are most impacted. This supports faster decision-making through focused identification of critical issues. Additionally, when used alongside trend analysis views, it helps track improvements over time and measure the effectiveness of remediation efforts.
Data Context
The data context for the Posture Anomaly Density view is derived from posture evaluation scans across container resources and services, where anomalies typically represent misconfigurations, compliance violations, and security risks. The data can be aggregated across multiple dimensions such as resource type, service, region, and severity (when enabled), allowing for more granular analysis and targeted remediation.
Granular Analysis and Targeted Remediation
When you click on a bubble count, it opens the Posture Anomaly Parameters popup, which presents a detailed table listing the ID, Title, and associated Resources for each anomaly.
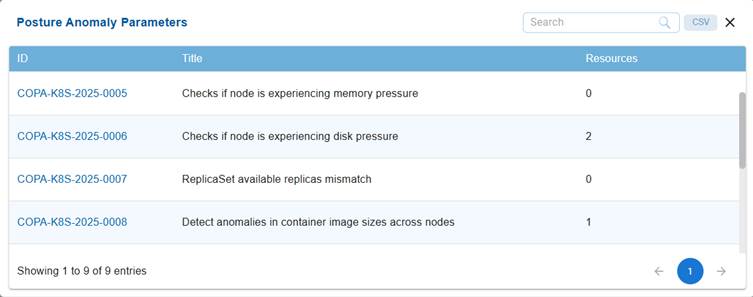
This facilitates targeted investigation and efficient prioritization of remediation planning. Click on the Resources count to see the details. Follow the links in anomaly ID column to open the Detailed summary page.
Filtering and Segmentation from the Detailed Summary
The filtering and segmentation capabilities allow you to refine analysis by applying filters based on severity levels (High, Medium, Low), resource categories or services, container providers or accounts, and time ranges derived from scan data.
This helps isolating specific anomaly clusters, facilitating more focused analysis and targeted remediation efforts.
Exploratory Analysis
You can also answer key operational questions by identifying the most impacted resources, detecting if anomalies are clustered within specific categories, assessing if larger concentrations point to systemic configuration or compliance gaps, and determining if remediation efforts should be prioritized for particular segments to effectively reduce overall risk.
As an example, the view supports answering key questions such as: Which resource types have the highest concentration of anomalies?, Are certain areas consistently more affected than others?, Do larger bubbles indicate deeper configuration or compliance issues?, and Should remediation efforts focus on a specific category to reduce overall risk?.
By exploring these questions, you can identify where anomalies are most dense and prioritize corrective actions more effectively.
Evaluate Anomaly Distribution Across Categories
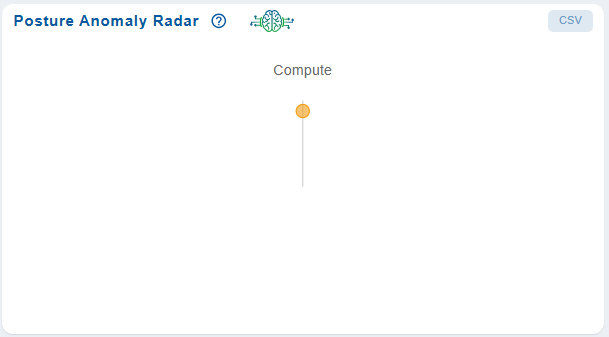
The Posture Anomaly Radar dashboard block helps visualize anomaly distribution based on predefined categories, helping you understand which areas contribute most to posture deviations.
Each plotted point represents a specific category, for example, Compute along with its associated weightage as shown in the illustration, indicates the relative impact or severity within the posture assessment.
Moving your cursor over a point reveals details like Category and Weightage, helping with quick insights into category-level anomaly concentration. The view also allows data export in CSV format for further analysis or reporting.
Fix Anomalies Detected In Your Kubernetes Account
The Anomalous and Non-Anomalous sections in the Kubernetes account help you monitor the health and stability of your Kubernetes clusters by differentiating between irregular and normal behavior.
Anomalous section identifies unusual or abnormal activities within the cluster, such as frequent Pod restarts, node disk pressure, or discrepancies in container image sizes. The presence of entries in this section indicates potential performance issues, anomalies, or instability that require immediate attention or investigation.
Non-Anomalous section lists the checks that do not have any issues or irregularities detected. For example, it may show that there are no pending Pods, no node connectivity issues, or stable ReplicaSet configurations. Any metrics showing zero in this section indicate that the cluster is operating normally and that system components are healthy.
In Saner Container Orchestration Posture Anomaly(COPA), the Anomalous section (typically displayed in red) highlights areas that need review or remediation, while the Non-Anomalous section (shown in green) confirms that critical Kubernetes components function as expected. Together, both the visuals provide a quick summary of cluster health, helping you to prioritize troubleshooting and maintain optimal performance.
Access the Anomalous and Non-Anomalous Instances in Kubernetes Clusters
Just click the All Anomalies link from the top-right of the COPA dashboard.

Monitor Anomalous Behavior in Kubernetes
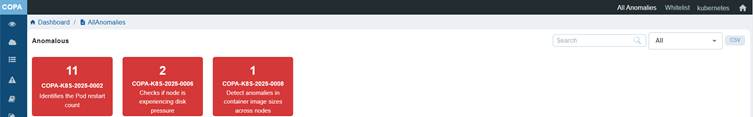
The Anomalous section helps you monitor irregular behavior across Kubernetes clusters.
Each red tile displays the total number of instances that were discovered under a particular anomaly. PA-ID details and a summary is shown on the tile. You can hover over the tile to get more information about the PA ID.
As an example, the red and green tile visualization supports answering key questions such as: What is causing the anomalies? Are they the result of resource constraints, anomalies, or unstable workloads?, Are these anomalies isolated incidents, or do they reflect a recurring pattern? How critical are the identified issues, and which ones should be prioritized for resolution?, What is functioning well in the non-anomalous areas, and can those configurations serve as best practices for other areas?
By answering these questions, you can focus on addressing high-risk issues while also reinforcing the stable aspects of the cluster.
The illustration highlights 11 instances of Pod restart anomalies (COPA-K8S-2025-0002), 2 cases of nodes experiencing disk pressure (COPA-K8S-2025-0006), and 1 instance of abnormal container image sizes across nodes (COPA-K8S-2025-0008).
This view helps identify and address potential performance and stability issues proactively.
Monitor Non-Anomalous Behavior in Kubernetes
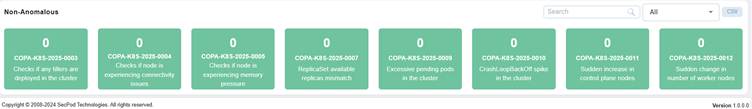
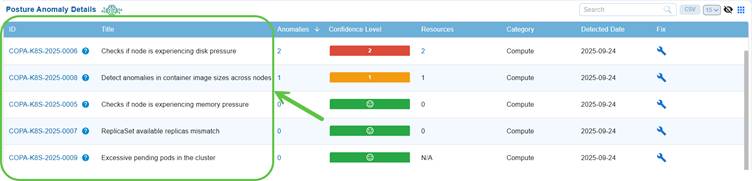
The Non-Anomalous section shows checks in the Kubernetes cluster where no irregularities have been detected.
As an example, the illustration highlights that All monitored parameters currently show a value of zero, indicating stable cluster performance. These checks include monitoring for deployed tillers (COPA-K8S-2025-0003), node connectivity or memory issues (COPA-K8S-2025-0004, 0005), ReplicaSet mismatches (0007), excessive pending pods (0009), CrashLoopBackOff spikes (0010), and sudden changes in control plane or worker nodes (0011, 0012).
This view confirms that the cluster is operating under normal conditions without performance or stability.
Investigate Anomalies at a Granular Level
The detailed summary view page allows users to examine anomalies in depth, offering insight into individual COPA IDs and their related resource attributes. By integrating both tabular data and visual representations, such as anomaly distribution and trend analysis, it helps users to quickly spot unusual patterns, evaluate confidence levels, and make informed decisions for remediation and performance optimization.
Explore More Details for the Selected COPA ID
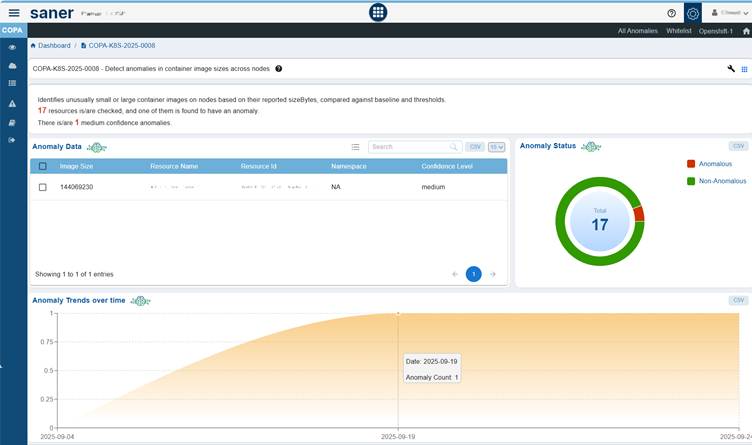
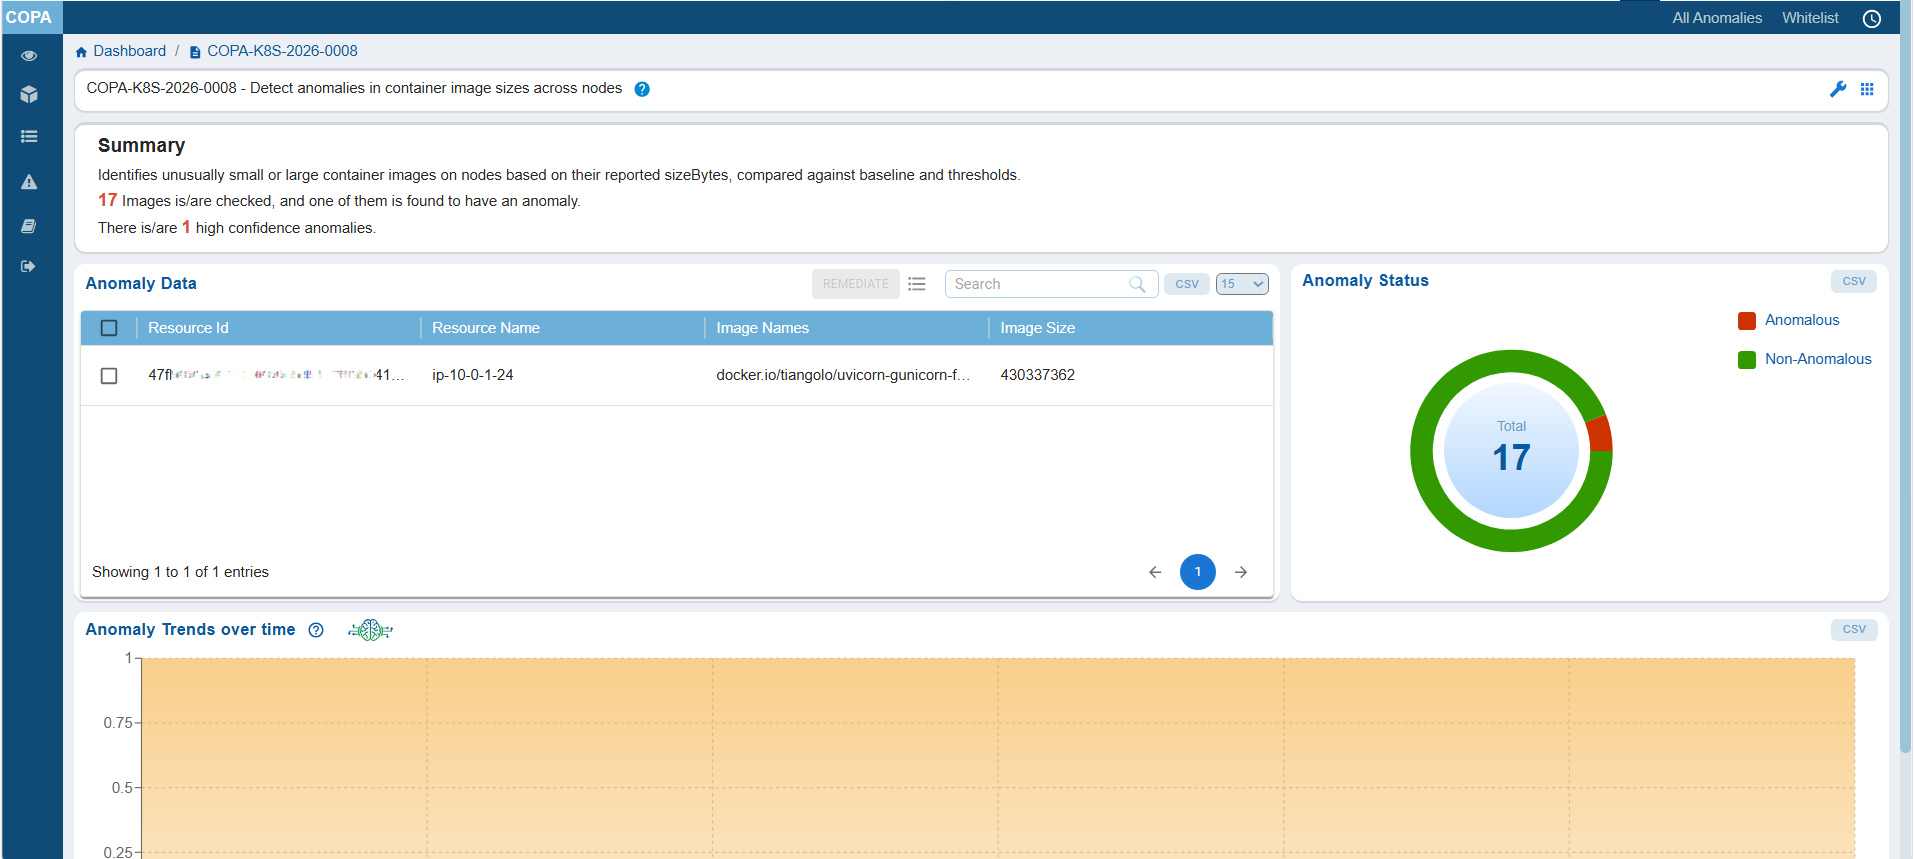
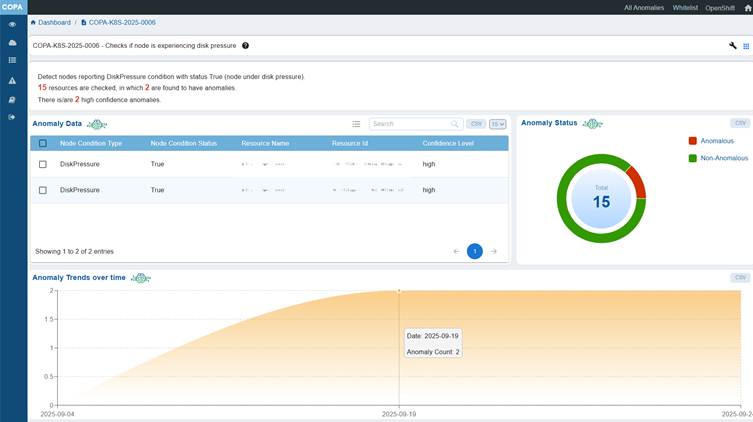
Clicking the ID(link) in the Posture Anomaly Details block initiates a drill-down action that opens a detailed summary of the selected COPA ID, including its title and description.
As an example, the Anomaly Data block provides a tabular representation with columns for Image Size, Resource Name, Resource ID, Namespace, and Confidence Level.
The Anomaly Status block displays a chart illustrating the distribution of anomalous and non-anomalous instances, along with their total count.
The Anomaly Trends Over Time block features an area chart where the x-axis represents the date (yyyy/mm/dd) and the y-axis indicates the anomaly count over the selected time period.
Complete the Remediation for the COPA ID
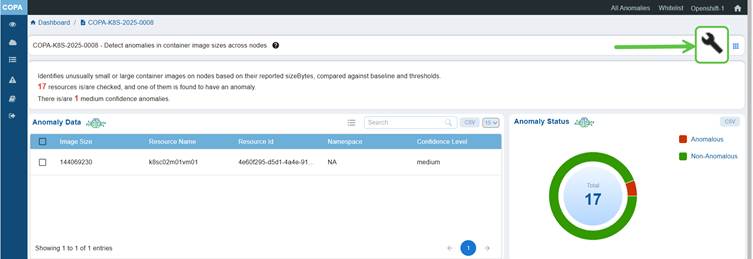
Click on the wrench button at the top right corner of the page to start the remediation for all the anomalies that fall under the COPA ID.
Whitelist COPA IDs
Whitelisting COPA IDs excludes known or validated anomalies from future detections and analysis. This helps reduce false positives, streamline anomaly monitoring, and ensure that only genuine deviations are flagged for investigation.
Saner Container COPA Whitelisting maintains dashboard accuracy and improves the efficiency of anomaly management by focusing attention on critical and unverified issues.
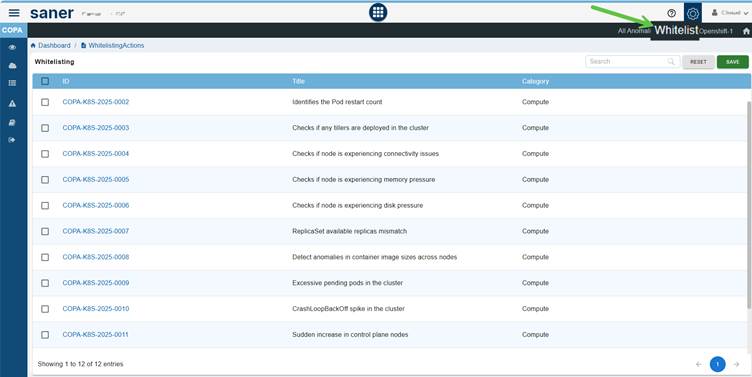
Step1: Click on the Whitelist option on the PA Dashboard. The Whitelisting page opens for you to proceed further.
Step2: Select the PA ID’s that you want to whitelist within your Kubernetes account. You have an option to select one or more PA ID’s here by clicking on the checkbox located on the left side right next within the ID column.
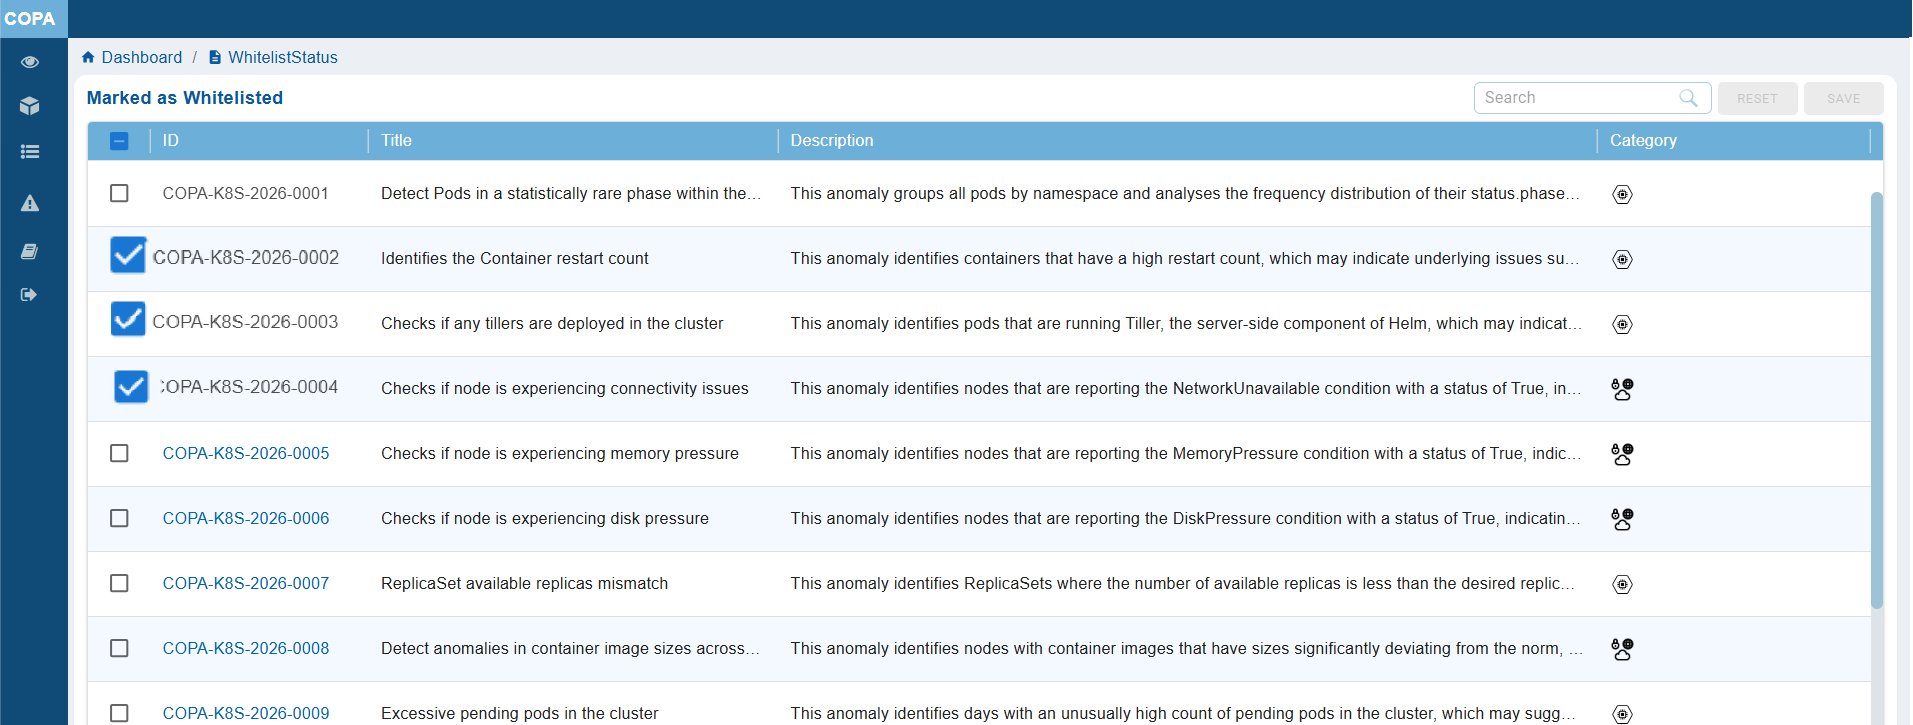
Step3: Click on the Save button located at the top-right corner of the page next to Reset button.
The COPA tool whitelists the selected the COPA ID’s and then performs a Posture Anomaly Scan on the account to recalculate the Anomaly status.
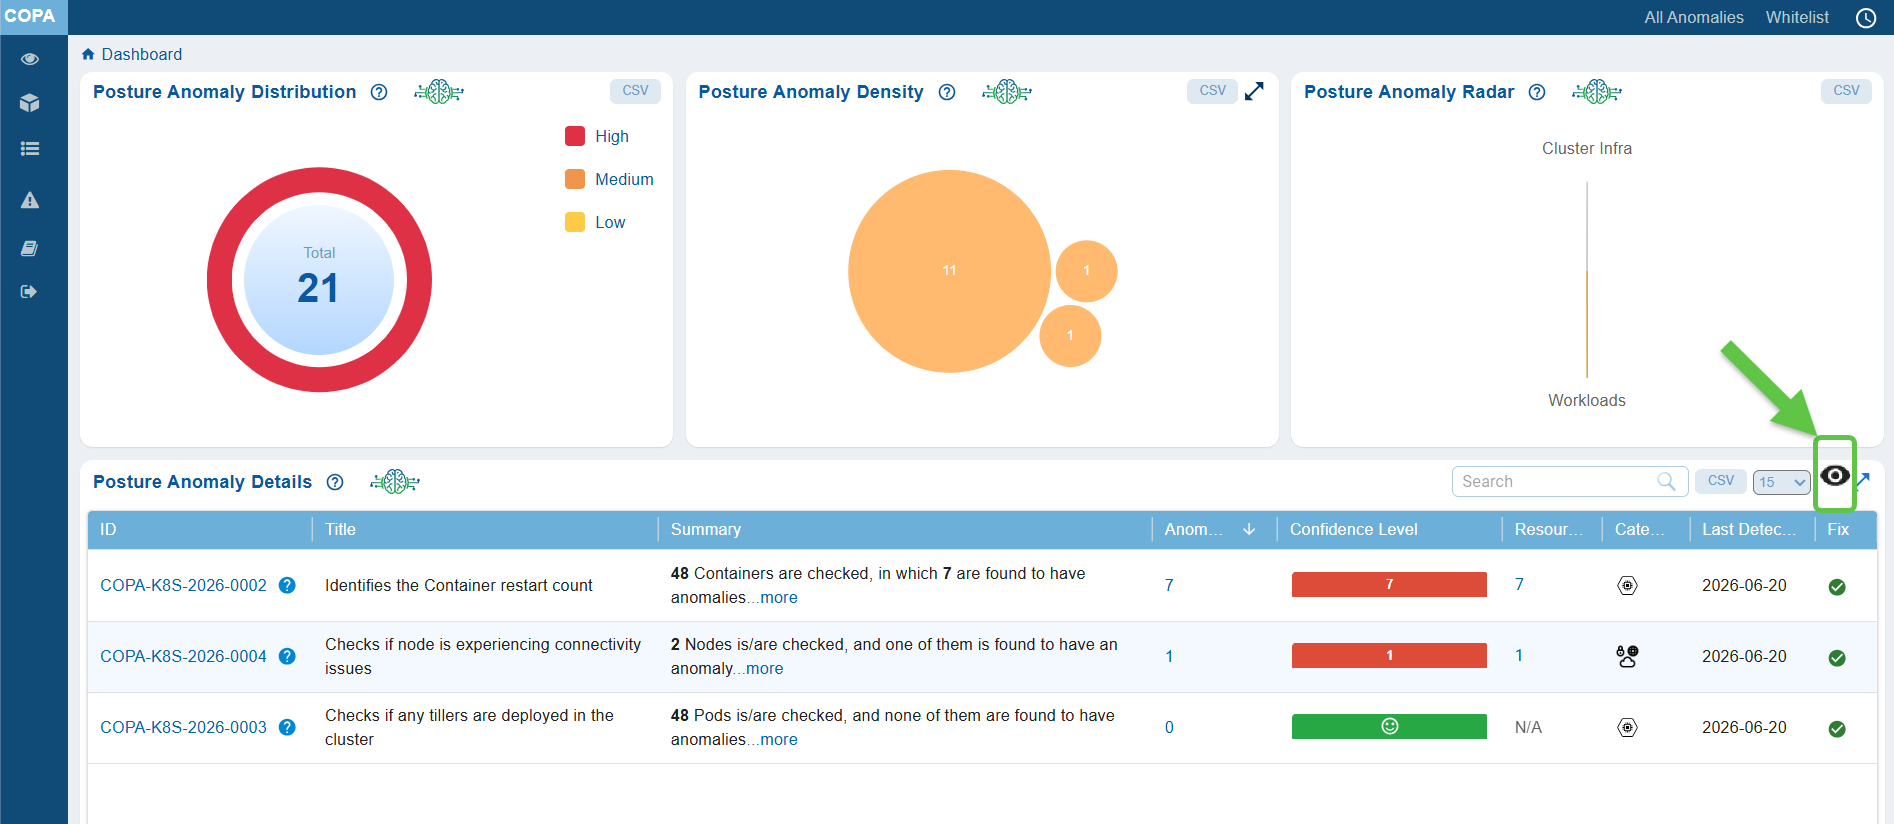
Step4: Now go to the COPA Dashboard to see all the non-whitelisted COPA IDs displayed under Posture Anomaly Details block.
You can see an “Eye” icon crossed in the Posture Anomaly Details dashboard block. This indicates that the whitelisted PA IDs exist and not displayed currently.
Step5: To see the whitelisted COPA ID’s in the dashboard block, click on the Eye icon.
Analyze and Investigate Detected Anomalies from COPA Dashboard
The Posture Anomaly Details block provides a comprehensive summary of anomalies detected across container or cluster environments. It allows users to quickly assess, prioritize, and investigate potential anomalies or security risks. Each column in the table provides specific details that help users drill down into the nature and impact of each anomaly, enabling faster remediation and informed decision-making.
Track Detected Anomaly with ID and Title
The unique identifier associated with each detected anomaly helps track the specific anomaly instances. With the descriptive title, understand the anomaly context that summarizes the nature of the anomaly or misconfiguration for quick recognition.
Drill-down into Detailed Insights
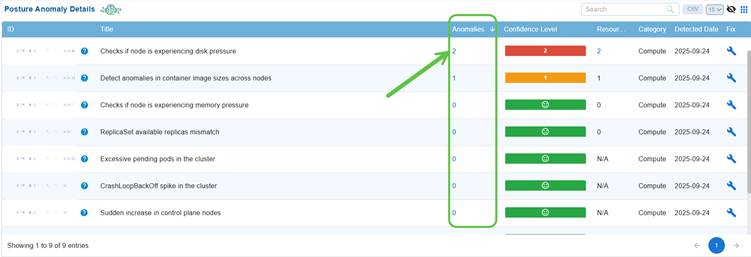
The Anomalies column displays the total count of anomalies detected for each resource or COPA ID.
Each count value is presented as a clickable link. Clicking the count opens a detailed summary page, providing a deeper view of the selected anomalies, including their severity, confidence level, resource details, and associated risk insights.
This enables quick investigation and contextual analysis directly from the dashboard.
Track Resources Count and Category
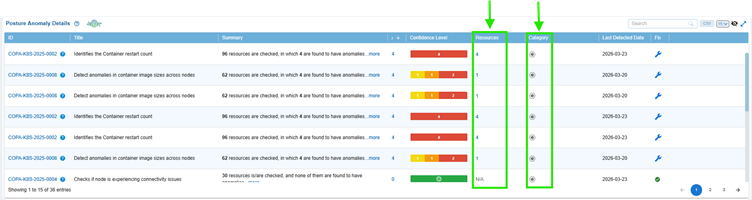
Get insight into the count of resources affected by the anomaly from the Resources column. Also, know the category to which the resource belongs to from the Category column.
Prioritize Remediation based on Confidence Level
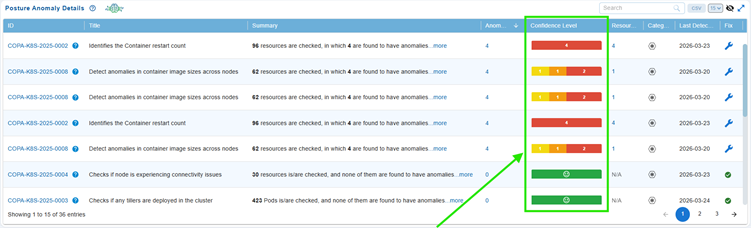
Confidence Level represents the degree of certainty with which the system assesses if a detected issue or misconfiguration poses a potential risk.
In Saner COPA, anomalies are categorized according to a machine learning-driven threshold or predefined severity levels. This classification reflects the system’s confidence that an anomaly indicates a genuine security or configuration risk:
- Red (High Confidence): Indicates highly reliable anomalies that represent significant risks and require immediate attention.
- Orange (Medium Confidence): Represents moderately reliable anomalies that may need further validation or investigation.
- Yellow (Low Confidence): Denotes less critical or uncertain anomalies, which could include minor issues or potential false positives.
This categorization helps prioritize remediation efforts, making sure that you address the high-impact issues first while efficiently allocating resources for lower-priority findings.
You have an option to review the Confidence Level to make informed decisions by accessing one of the following:
- The “Posture Anomaly Details” block within the COPA dashboard
- The “Posture Anomaly Distribution” block on the COPA dashboard
Initiate Patch Remediation
Remediation of findings from Saner Container Orchestration Posture Anomaly(COPA) dashboard involves systematically addressing the anomalies by identifying and resolving risks within your AWS account directly from the interface with ease.
You have an option to initiate the patching task in one of the following ways:
Option1: By Accessing the Fix (Wrench) Icon from the Posture Anomaly Details Block on the Dashboard
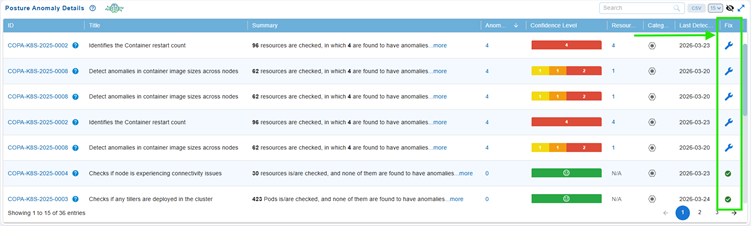
Step 1: Go straight to the Posture Anomaly Details block in the COPA dashboard and click on the Fix (wrench) icon corresponding to an anomaly.
Step 2: Automatic Redirection to CSRM
The application automatically redirects you to Container Orchestration Security Remediation Management(CORM) and opens the COPA Tabular Listing to begin the patching activity.
Step 3: Follow the Wizard
The wizard guides you through the process of selecting and applying the necessary patches.
Option2: From the COPA Detailed Summary Page
Click to read more on how to complete the remediation for the COPA ID.
Identify When the Anomaly was Found
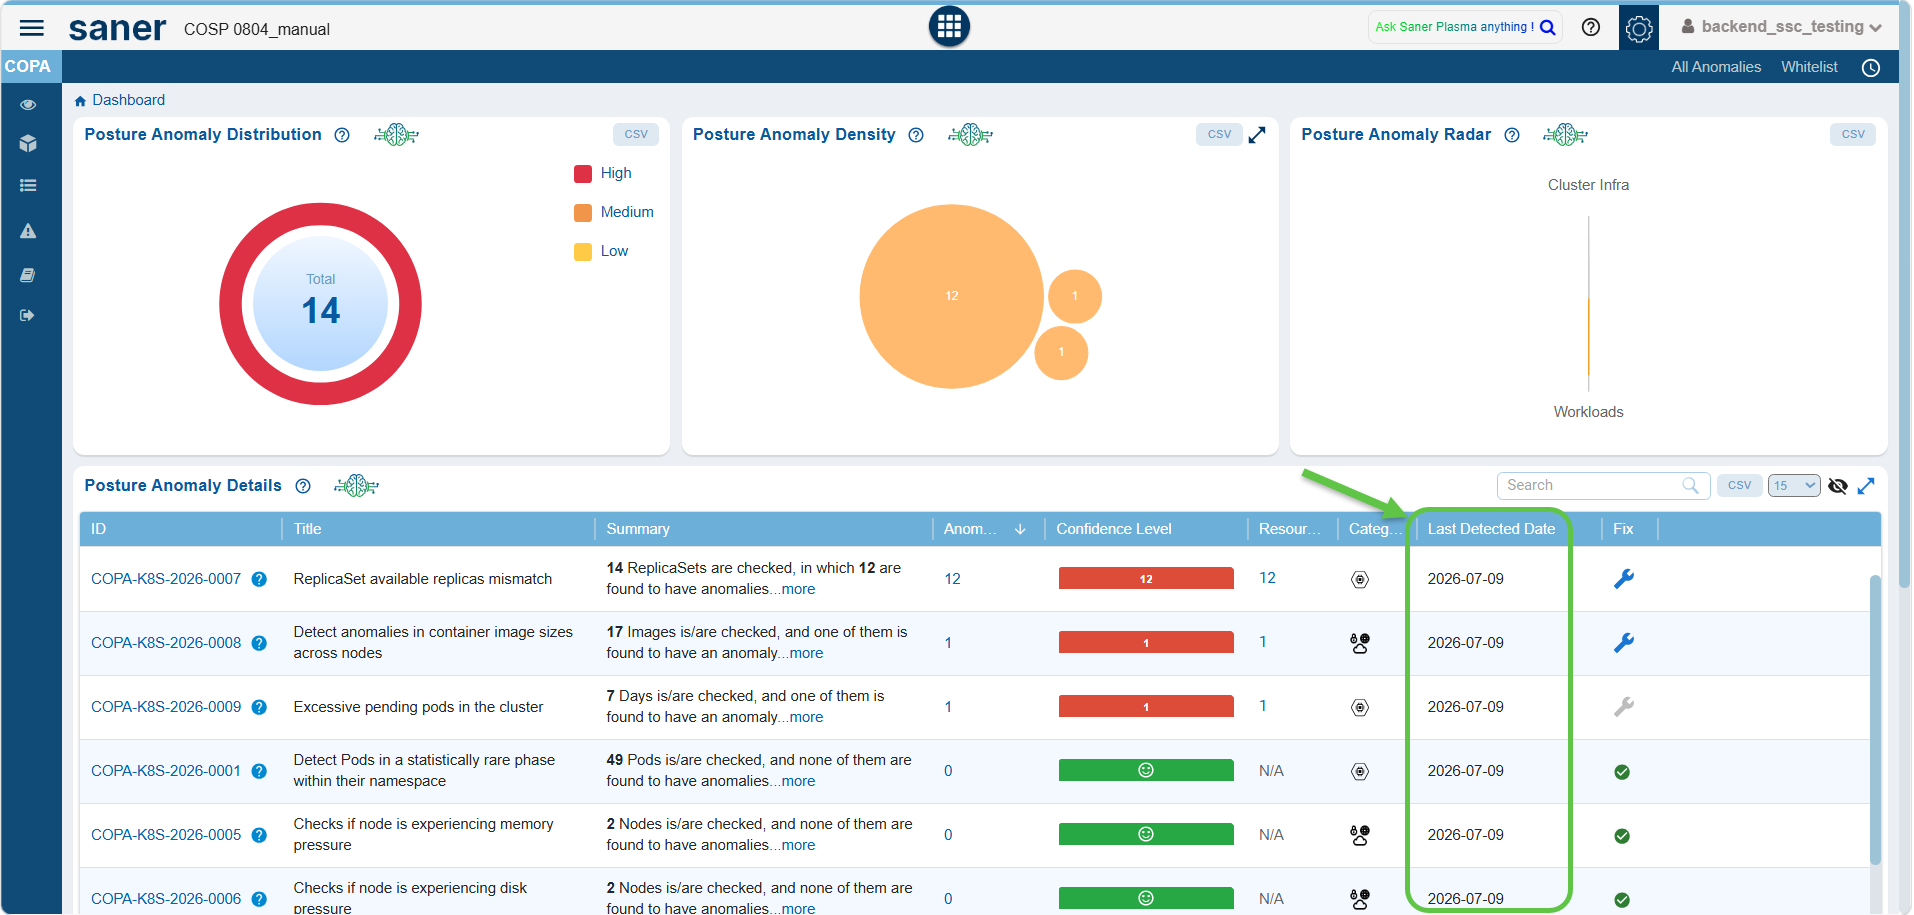
The Last Detected Date indicates the exact date when the anomaly was first identified by the Saner COPA system. This date helps you to track when an issue initially occurred. This information is crucial for trend analysis, incident investigation, and prioritizing remediation efforts based on how long an anomaly has been active.
Track Anomaly Trends Over Time
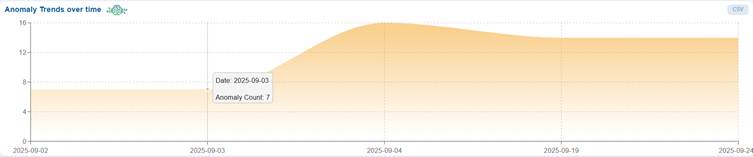
The Anomaly Trends Over Time chart provides a visual assessment of how well anomalies get managed over time, if issues get fixed, persists, or increases in number.
The Trend Chart offers a time-based visualization of anomaly counts, allowing you to monitor changes and identify unusual patterns or deviations.
Presented as an area chart, it displays dates (in the format yyyy/mm/dd) on the x-axis and anomaly counts on the y-axis over the selected period. This visualization facilitates a quick assessment of confidence levels and empowers users to make informed decisions for effective remediation planning and overall performance optimization.
For example, the “Anomaly Trends Over Time” chart allows you to observe how the number of anomalies changes over a selected period. It enables you to quickly identify any spikes or drops in the data and prompts questions such as: Are the number of anomalies increasing or decreasing lately?, Did any specific events occur on the days with sudden spikes?, Could recent changes or deployments be influencing these trends?, Do you see any recurring patterns over time?
These insights help you understand the connection between system activity and anomaly behavior, allowing you to take proactive measures before small issues escalate into larger problems.
The illustration also indicates that anomaly count has increased on 2025-09-04, levelled-down and evened out from then on. This helps teams monitor remediation effectiveness, detect persistent risks, and prioritize actions for high-severity issues.
Move your cursor over the chart to see the anomaly count on a specific date. Additionally, you also have an option to export the data into CSV(available on top-right of the block) for further analysis.
Commonly Asked Questions
What is COPA and how does it function within the Saner CNAPP ecosystem?
COPA (Container Orchestration Posture Anomaly) is a posture analysis module that detects, classifies, and remediates configuration anomalies across container and Kubernetes environments. It operates on posture evaluation scans driven by policies, benchmarks, and security rules, and integrates with remediation workflows via CSRM.
What data sources does COPA rely on for anomaly detection?
COPA uses data generated from:
- Posture evaluation scans
- Configured policies and compliance benchmarks
- Resource metadata across container services and Kubernetes clusters
How does COPA classify anomaly severity?
Anomalies are categorized into:
- High (Red): Critical risks requiring immediate action
- Medium (Orange): Moderate risks needing validation
- Low (Yellow): Minor or potential false positives
This classification is derived from rule severity and system evaluation logic.
What is Posture Anomaly Density and how is it calculated?
Posture Anomaly Density represents the concentration of anomalies across resources. It is derived by aggregating anomaly counts across dimensions like:
- Resource type
- Service
- Region
- Severity
Displayed via a bubble chart, where bubble size corresponds to impacted resource count.
What insights can be derived from anomaly trend analysis?
Trend analysis helps identify:
- Increase/decrease in anomaly count over time
- Impact of deployments or configuration changes
- Effectiveness of remediation efforts
- Recurring anomaly patterns
How does the anomaly radar view help in analysis?
The radar view visualizes anomaly distribution across categories (e.g., Compute, Storage). It helps:
- Identify high-impact domains
- Understand category-level risk concentration
- Prioritize remediation by domain
What is the purpose of the confidence level in anomalies?
Confidence level indicates the likelihood that an anomaly represents a real risk:
- High: Strong signal, high priority
- Medium: Needs validation
- Low: Possibly noise or low impact
It helps optimize remediation prioritization.
How are anomalous and non-anomalous states differentiated?
- Anomalous: Indicates abnormal or risky behavior requiring investigation
- Non-Anomalous: Indicates healthy system state with no detected issues
This dual visibility ensures both risk detection and stability validation.
Related Topics

